AAPL Trading Predictions
1 Day Prediction
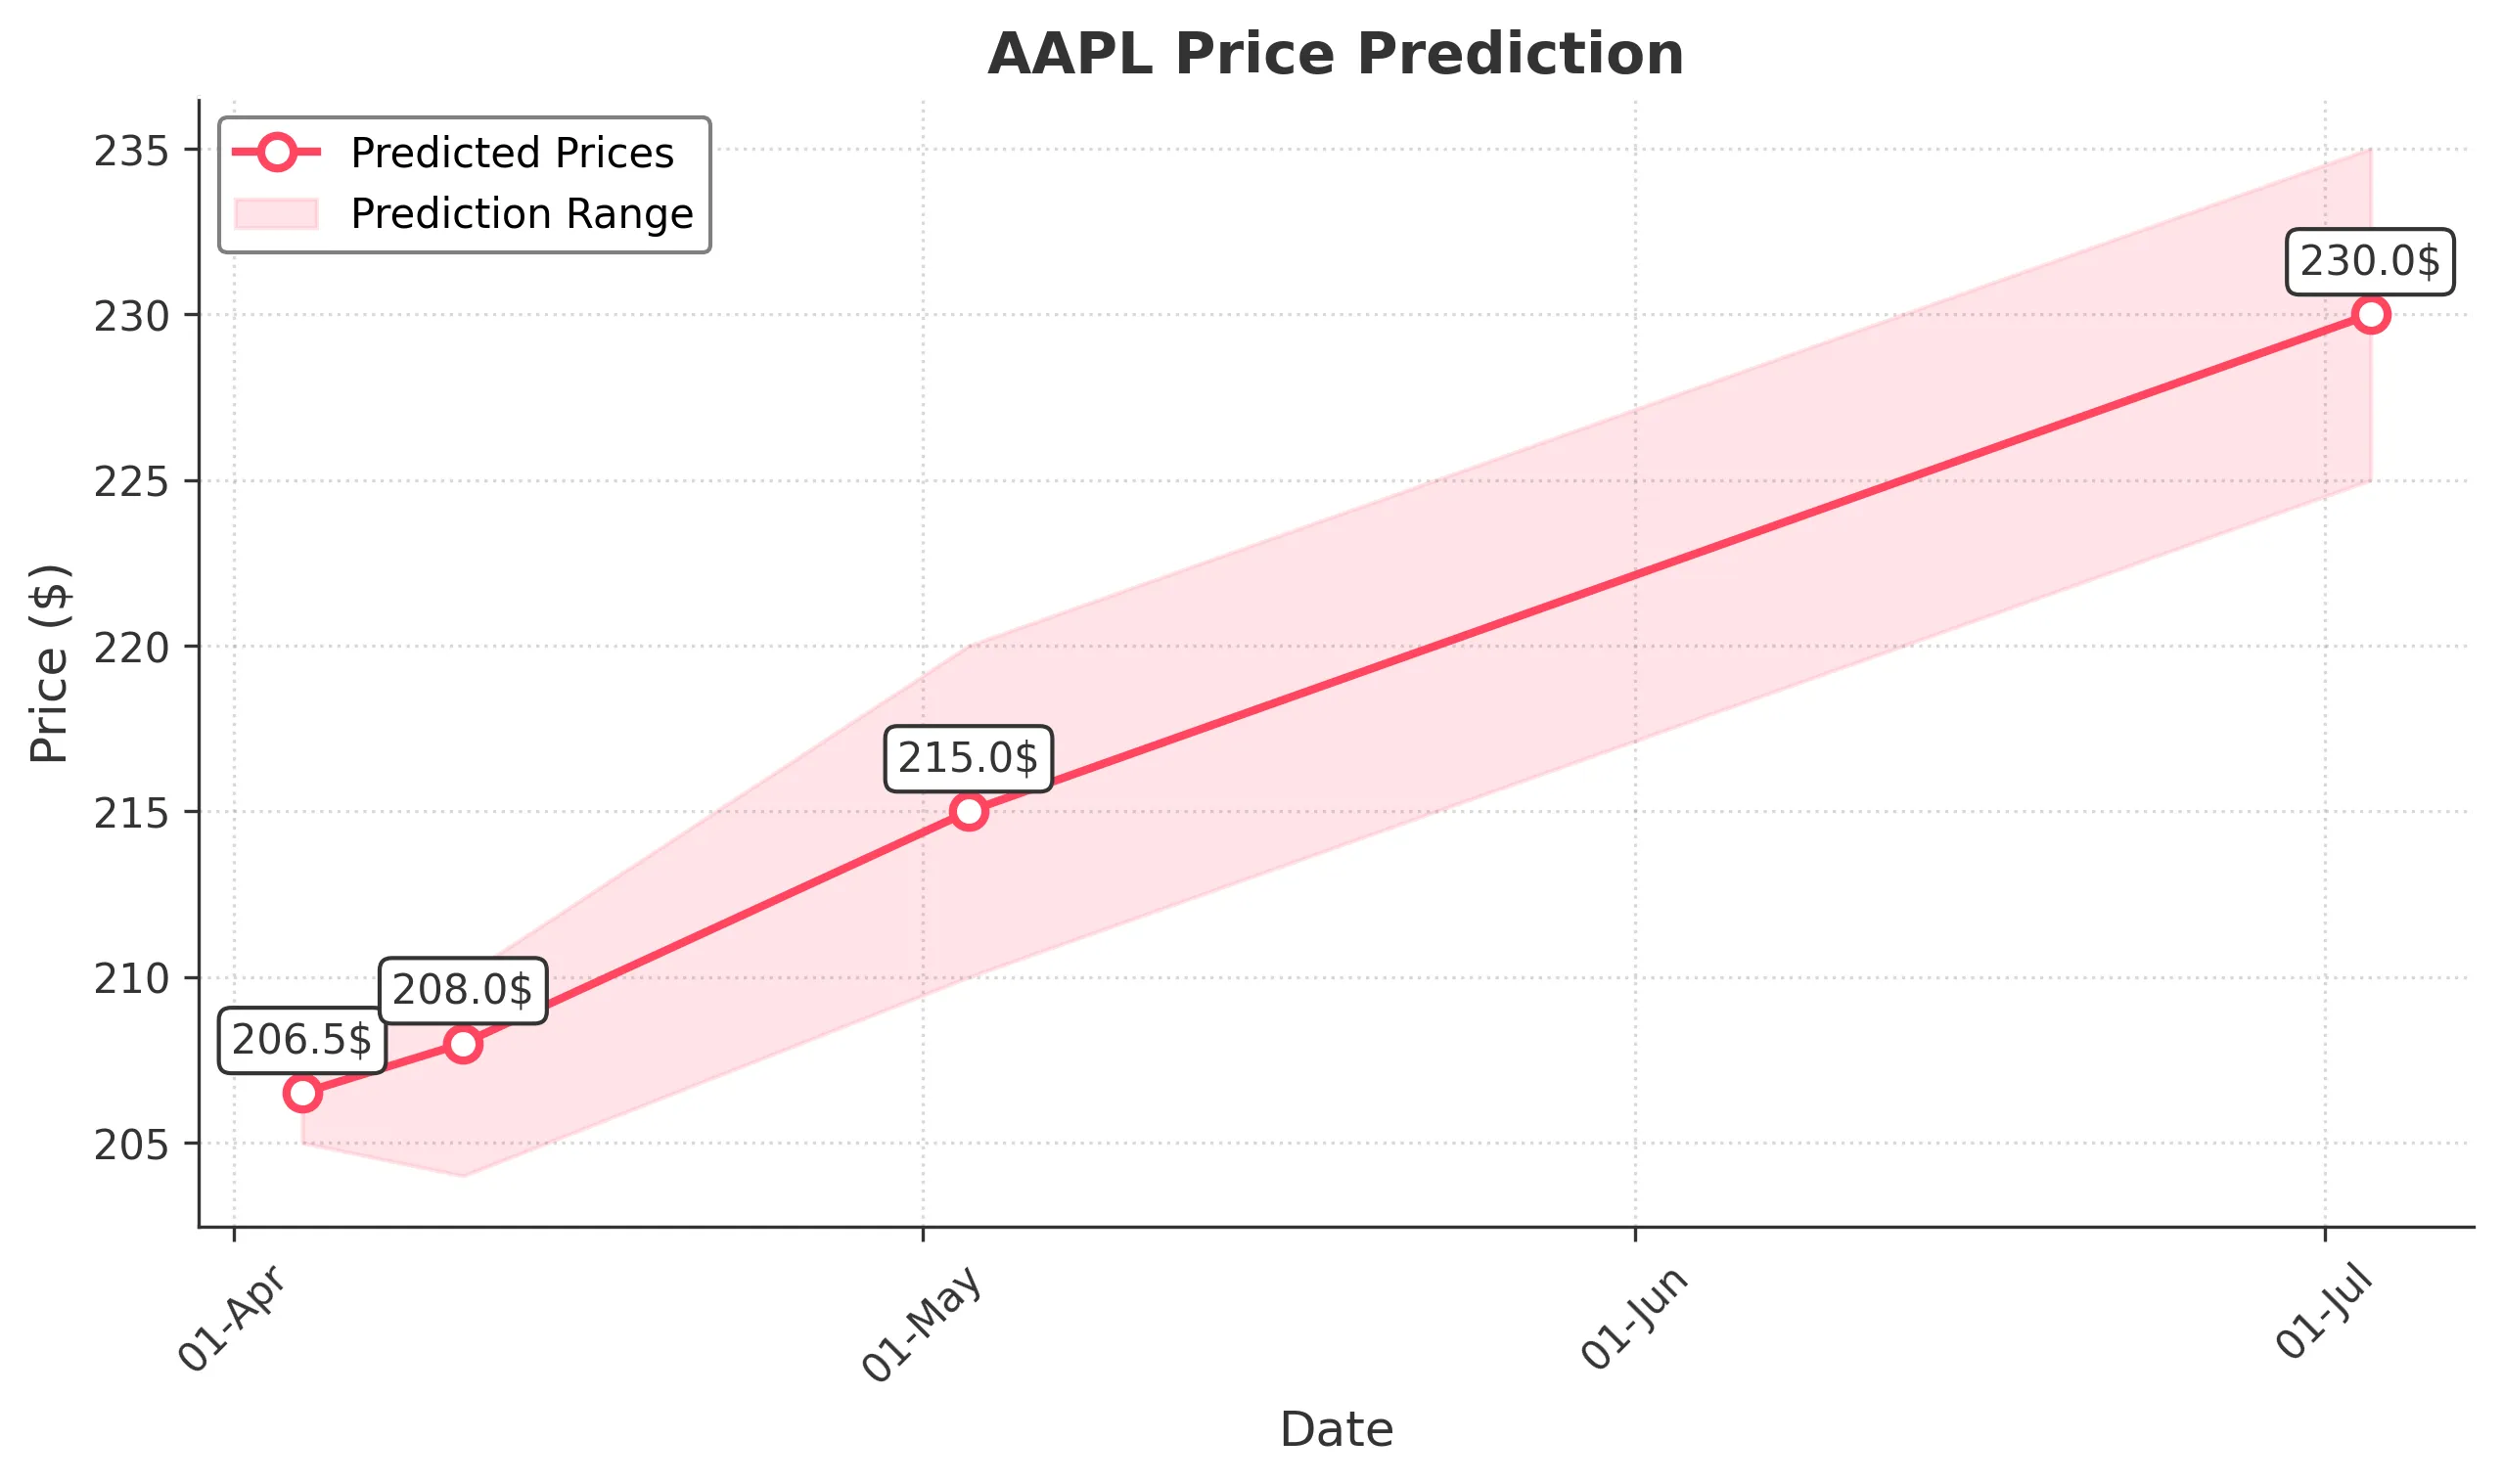
Target: April 4, 2025$206.5
$207.5
$208
$205
Description
AAPL shows bearish momentum with recent lower closes and high volume on down days. The RSI indicates oversold conditions, suggesting a potential bounce, but the overall trend remains weak. MACD is also bearish, indicating further downside risk.
Analysis
Over the past 3 months, AAPL has experienced a bearish trend with significant support around $205. Technical indicators like the MACD and RSI suggest weakness, while volume spikes on down days indicate selling pressure. The stock is currently below key moving averages, indicating a lack of bullish momentum.
Confidence Level
Potential Risks
Market volatility and potential news could impact the stock's performance. A reversal pattern could emerge if bullish sentiment returns.
1 Week Prediction
Target: April 11, 2025$208
$206.5
$210
$204
Description
AAPL may see a slight recovery as it approaches a key support level. The RSI is nearing oversold territory, which could trigger a short-term bounce. However, bearish sentiment persists, and any recovery may be limited.
Analysis
The stock has been in a downtrend, with significant resistance at $210. Volume analysis shows increased selling pressure, while the ATR indicates rising volatility. The market sentiment remains cautious, and any bullish reversal will need strong catalysts.
Confidence Level
Potential Risks
Unforeseen macroeconomic events or earnings reports could lead to increased volatility, impacting the prediction.
1 Month Prediction
Target: May 3, 2025$215
$212
$220
$210
Description
AAPL may recover towards $215 as it tests previous support levels. The potential for a bullish reversal exists if the stock can break above $210. However, the overall market sentiment remains cautious, and external factors could hinder recovery.
Analysis
The stock has shown signs of consolidation around $210, with key resistance at $220. Technical indicators suggest a potential reversal, but the overall bearish trend and market sentiment could limit upward movement. Volume patterns indicate cautious trading.
Confidence Level
Potential Risks
Continued bearish trends or negative news could prevent the stock from reaching the predicted levels.
3 Months Prediction
Target: July 3, 2025$230
$228
$235
$225
Description
If AAPL can stabilize and break key resistance levels, it may trend towards $230. The market could shift positively if macroeconomic conditions improve, but risks remain due to ongoing volatility.
Analysis
AAPL's performance over the past three months has been bearish, with significant resistance at $235. The stock's volatility is high, and while there are signs of potential recovery, external factors could lead to further declines. The overall market sentiment remains uncertain.
Confidence Level
Potential Risks
Market conditions, including economic indicators and earnings reports, could significantly impact the stock's trajectory.