AAPL Trading Predictions
1 Day Prediction
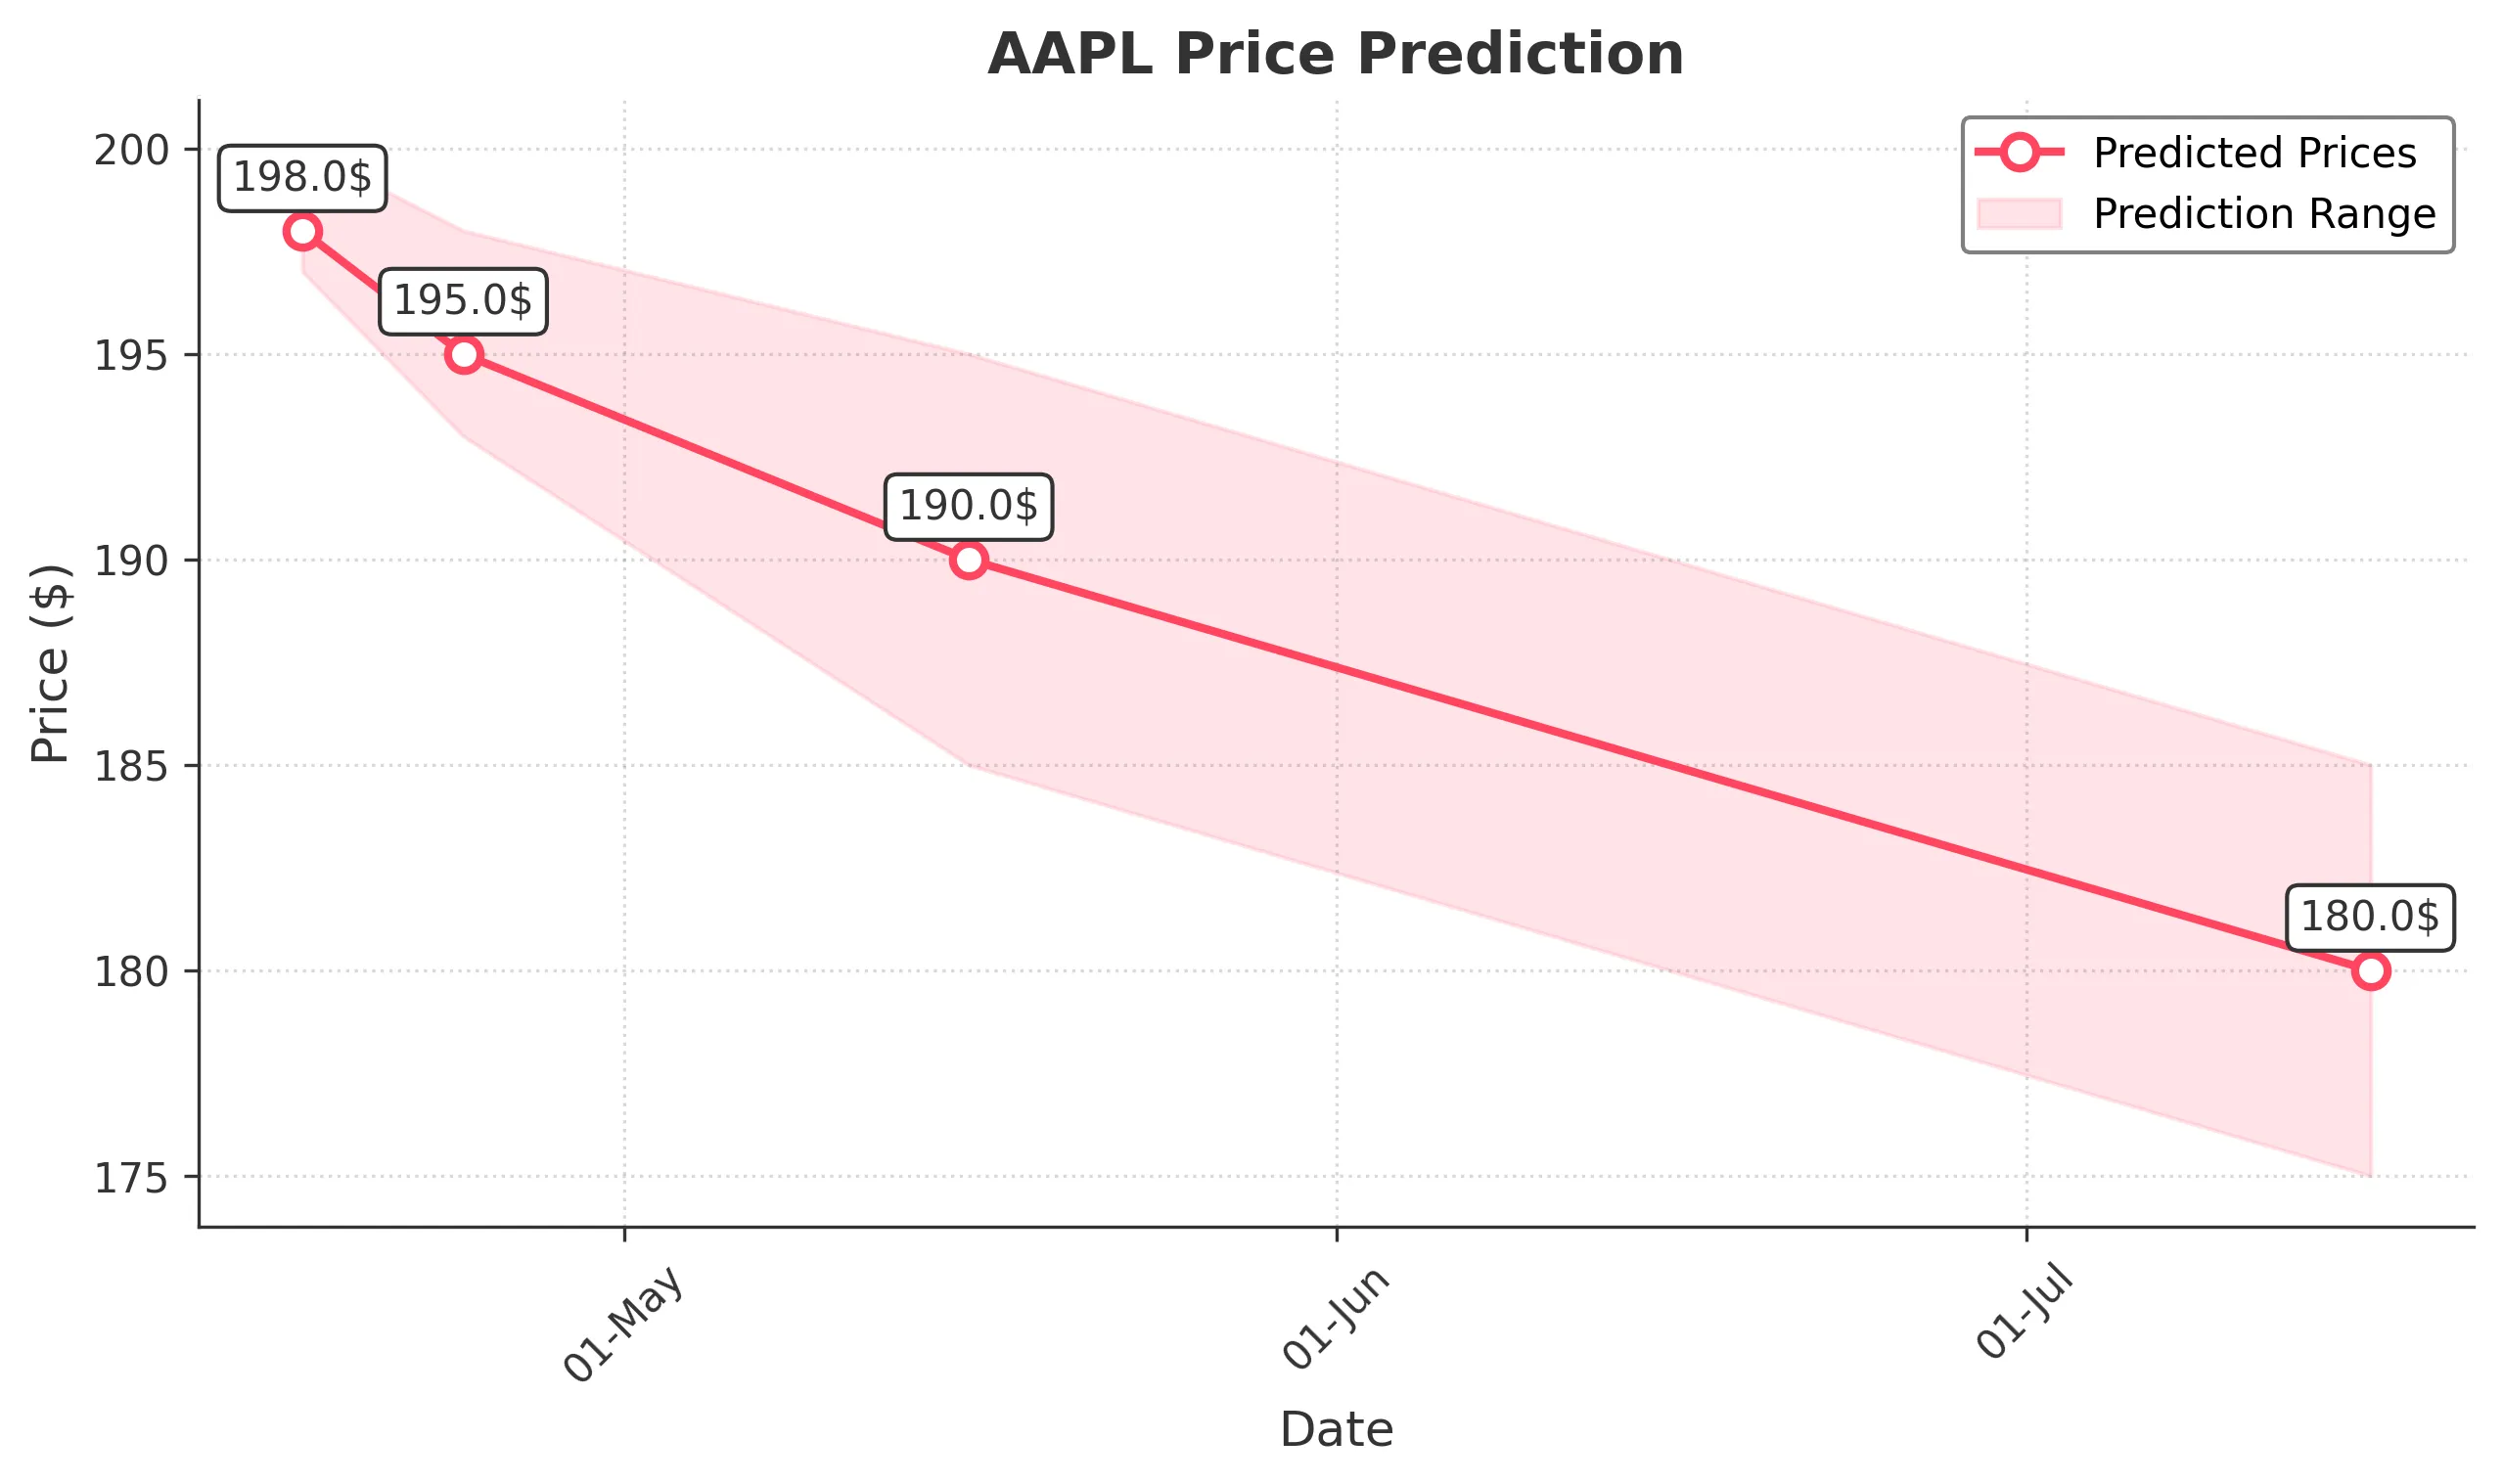
Target: April 17, 2025$198
$199
$200
$197
Description
AAPL shows bearish momentum with recent lower highs and lows. The RSI indicates oversold conditions, suggesting a potential bounce. However, the MACD is bearish, and volume has been declining, indicating caution. Expect a slight recovery but overall bearish sentiment.
Analysis
Over the past 3 months, AAPL has experienced significant volatility, with a bearish trend emerging recently. Key support is around $198, while resistance is at $210. The MACD is bearish, and the RSI indicates oversold conditions, suggesting potential for a short-term bounce. Volume has been inconsistent, with spikes during sell-offs.
Confidence Level
Potential Risks
Market volatility and external news could impact the prediction. AAPL's recent performance has been erratic, and any negative news could lead to further declines.
1 Week Prediction
Target: April 24, 2025$195
$197
$198
$193
Description
The bearish trend is expected to continue, with AAPL facing resistance at $200. The recent candlestick patterns suggest indecision, and the overall market sentiment remains cautious. Volume may increase as traders react to earnings reports.
Analysis
AAPL has been in a bearish phase, with significant price drops and lower trading volumes. Key support is at $193, while resistance is at $200. The ATR indicates increased volatility, and the market sentiment is cautious, influenced by macroeconomic factors.
Confidence Level
Potential Risks
Earnings reports and macroeconomic factors could lead to unexpected volatility. AAPL's performance is sensitive to broader market trends.
1 Month Prediction
Target: May 16, 2025$190
$192
$195
$185
Description
AAPL is likely to continue its downward trend, with potential for further declines as market sentiment remains bearish. The MACD and RSI suggest continued weakness, and volume spikes may indicate panic selling.
Analysis
The past three months have shown a clear bearish trend for AAPL, with significant price drops and increased volatility. Key support levels are being tested, and the market sentiment is negative. The MACD and RSI indicate weakness, suggesting further declines may be ahead.
Confidence Level
Potential Risks
Unforeseen market events or positive news could reverse the trend. The stock's performance is highly correlated with broader market movements.
3 Months Prediction
Target: July 16, 2025$180
$182
$185
$175
Description
AAPL may continue to face downward pressure due to ongoing bearish sentiment and potential macroeconomic challenges. The stock's volatility is expected to remain high, with significant resistance at $185.
Analysis
AAPL's performance over the last three months has been characterized by significant declines and increased volatility. The stock is currently testing key support levels, and bearish sentiment prevails. The MACD and RSI indicate continued weakness, suggesting further declines may be likely.
Confidence Level
Potential Risks
Market conditions can change rapidly, and any positive developments could lead to a reversal. The stock's performance is heavily influenced by external factors.