AAPL Trading Predictions
1 Day Prediction
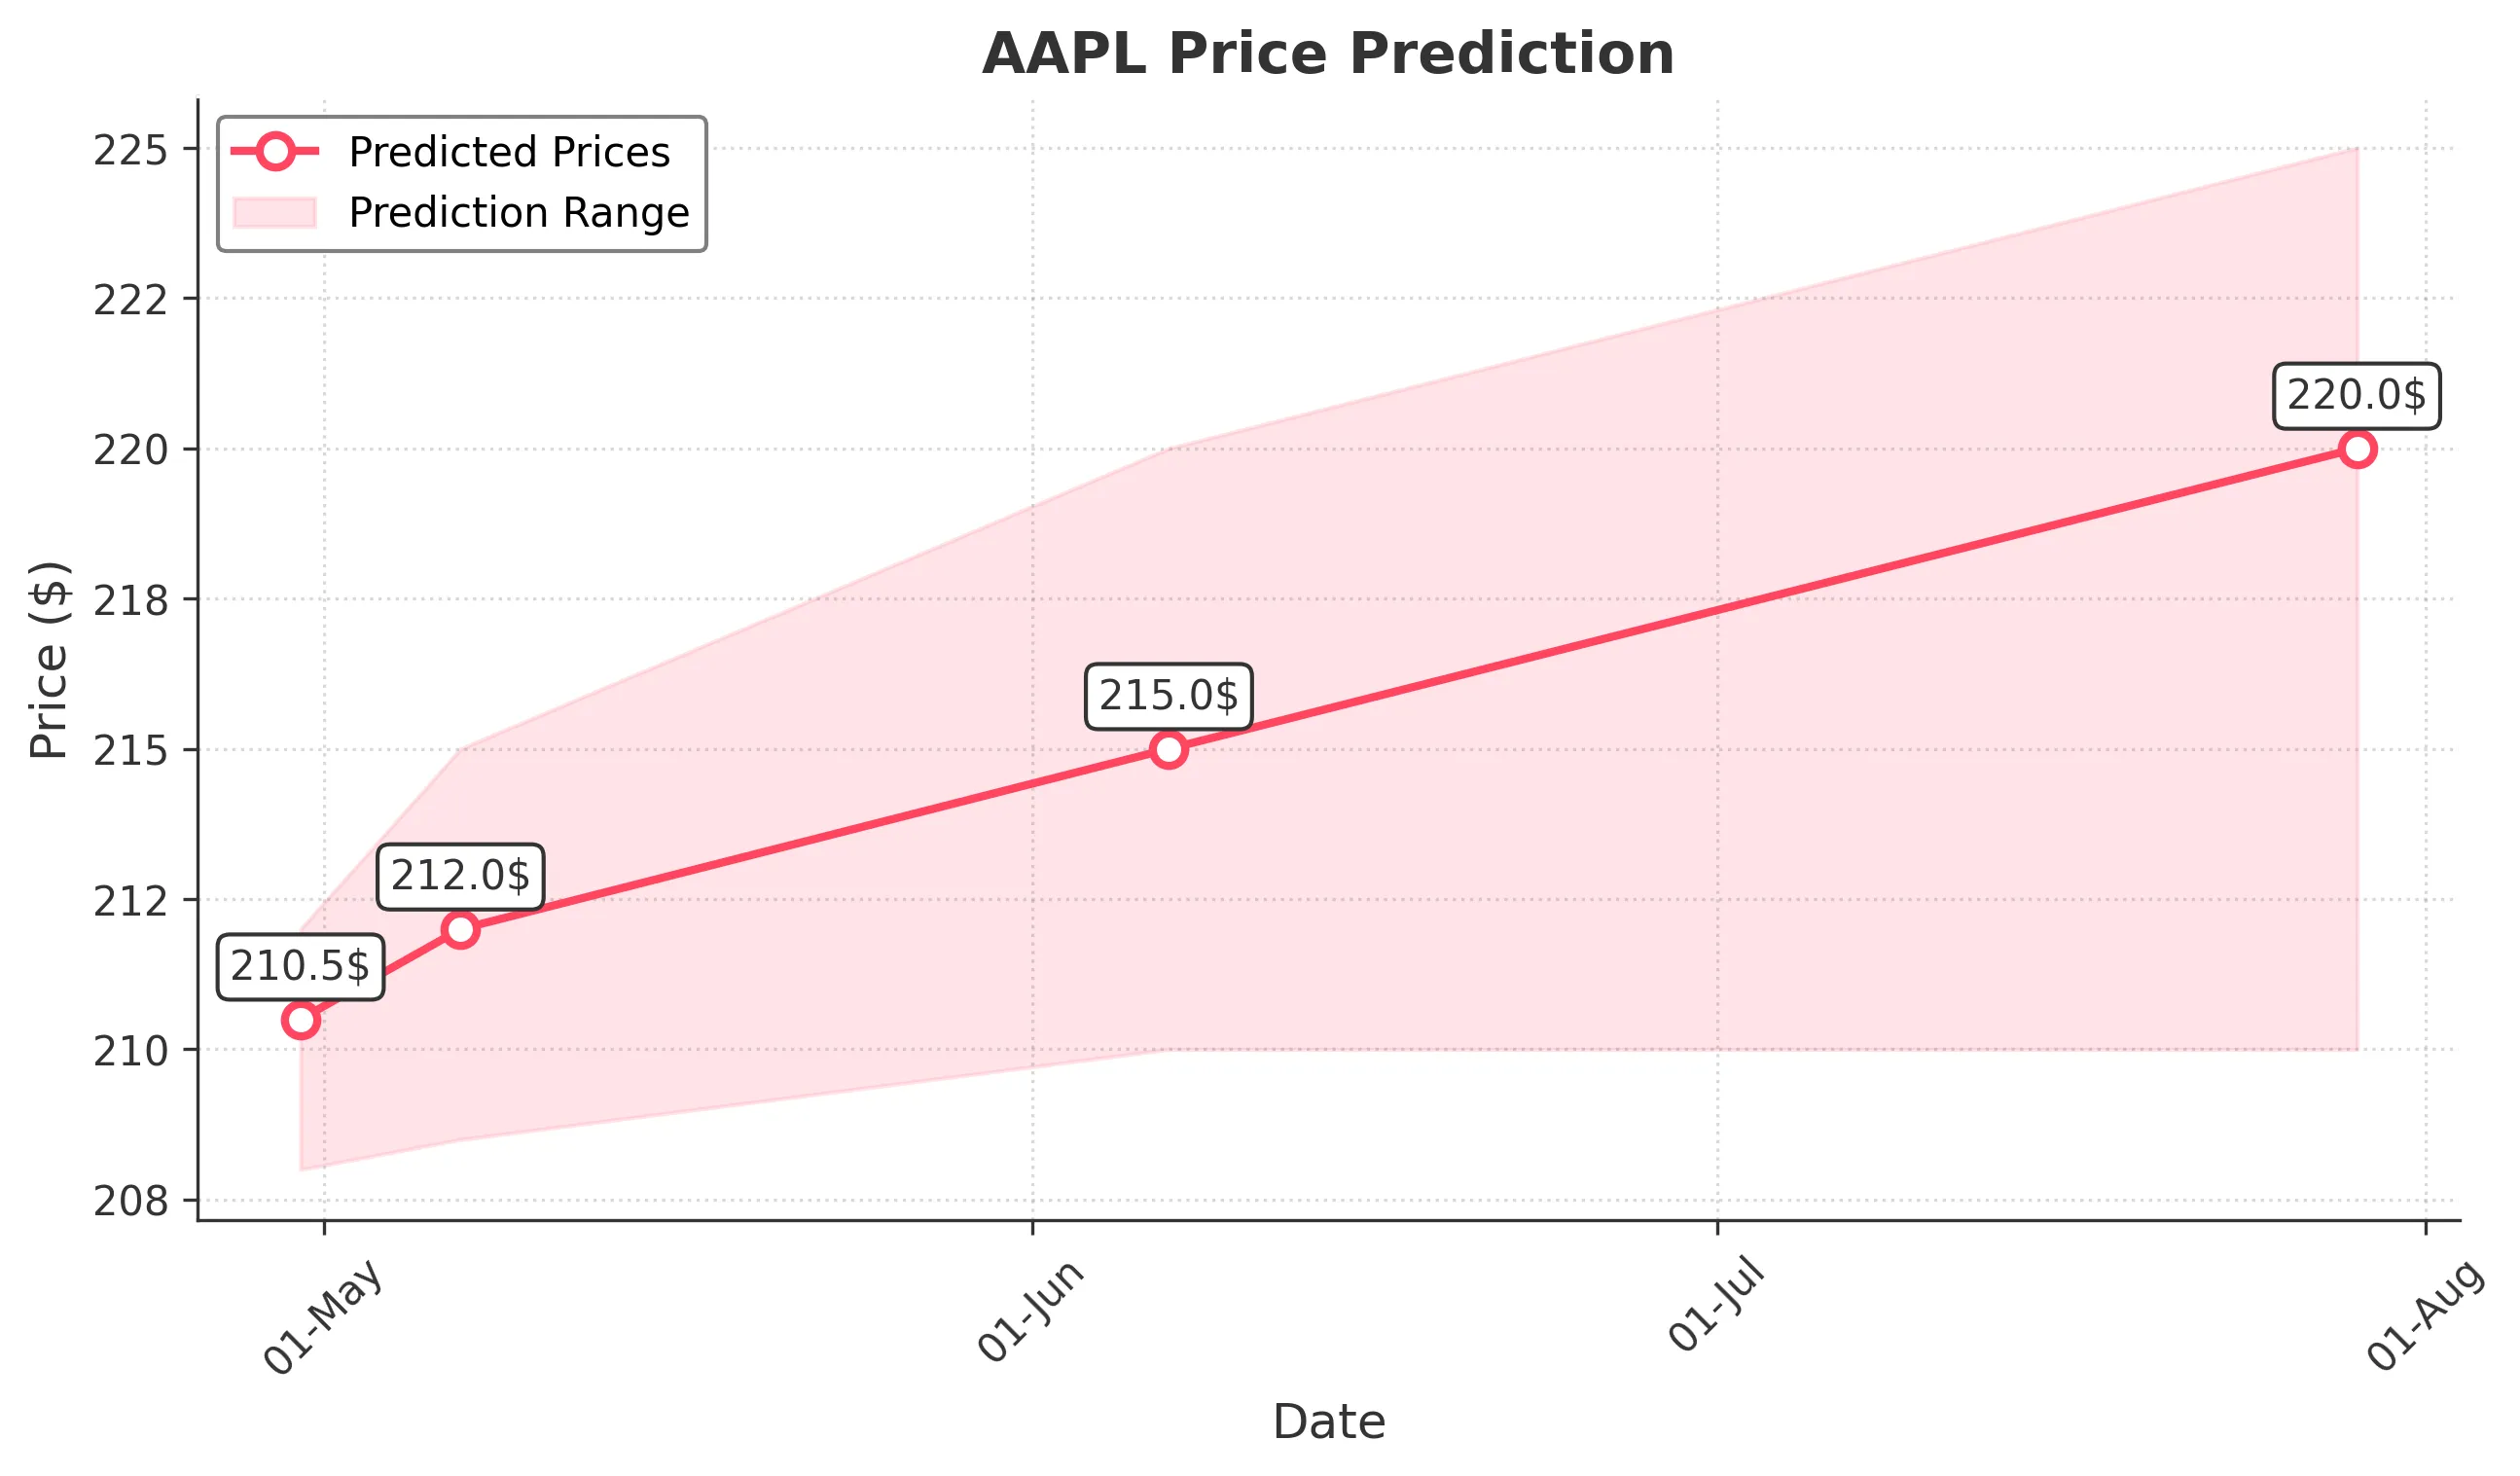
Target: April 30, 2025$210.5
$209.5
$212
$208
Description
AAPL shows signs of stabilization after recent volatility. The RSI is neutral, and MACD indicates a potential bullish crossover. However, recent bearish candlestick patterns suggest caution. Volume is expected to be moderate as traders await earnings reports.
Analysis
Over the past 3 months, AAPL has experienced significant volatility, with a bearish trend recently. Key support is around $200, while resistance is near $220. The ATR indicates high volatility, and recent volume spikes suggest increased trading activity. The overall sentiment is mixed, with potential for both upward and downward movements.
Confidence Level
Potential Risks
Market sentiment could shift rapidly due to earnings announcements or macroeconomic news, which may impact the stock's performance.
1 Week Prediction
Target: May 7, 2025$212
$210.5
$215
$208.5
Description
AAPL may see a slight recovery as it approaches key resistance levels. The MACD is showing bullish momentum, and the RSI is moving towards overbought territory. However, caution is warranted due to recent bearish patterns.
Analysis
The stock has been in a bearish phase recently, with significant price drops. Support is at $200, while resistance is at $220. The volume has been inconsistent, indicating uncertainty among investors. Technical indicators suggest a possible rebound, but external factors could influence the outcome.
Confidence Level
Potential Risks
Potential market corrections or negative news could reverse the upward trend, impacting the prediction.
1 Month Prediction
Target: June 7, 2025$215
$212
$220
$210
Description
AAPL is expected to stabilize around $215 as it tests resistance levels. The MACD indicates potential bullish momentum, but the RSI suggests overbought conditions. Market sentiment remains cautious due to macroeconomic factors.
Analysis
AAPL has shown a bearish trend recently, with significant price fluctuations. Key support is at $200, while resistance is at $220. The ATR indicates high volatility, and recent trading volumes suggest mixed investor sentiment. The outlook remains uncertain, with potential for both upward and downward movements.
Confidence Level
Potential Risks
Economic indicators and earnings reports could lead to volatility, affecting the stock's performance.
3 Months Prediction
Target: July 29, 2025$220
$215
$225
$210
Description
AAPL may recover to $220 as it approaches key resistance levels. The MACD shows bullish momentum, but the RSI indicates potential overbought conditions. Market sentiment could shift based on macroeconomic developments.
Analysis
The stock has been volatile, with a bearish trend recently. Key support is at $200, while resistance is at $220. The ATR indicates high volatility, and trading volumes have been inconsistent. The outlook remains uncertain, with potential for both upward and downward movements.
Confidence Level
Potential Risks
Unforeseen market events or economic downturns could significantly impact the stock's trajectory.