AAPL Trading Predictions
1 Day Prediction
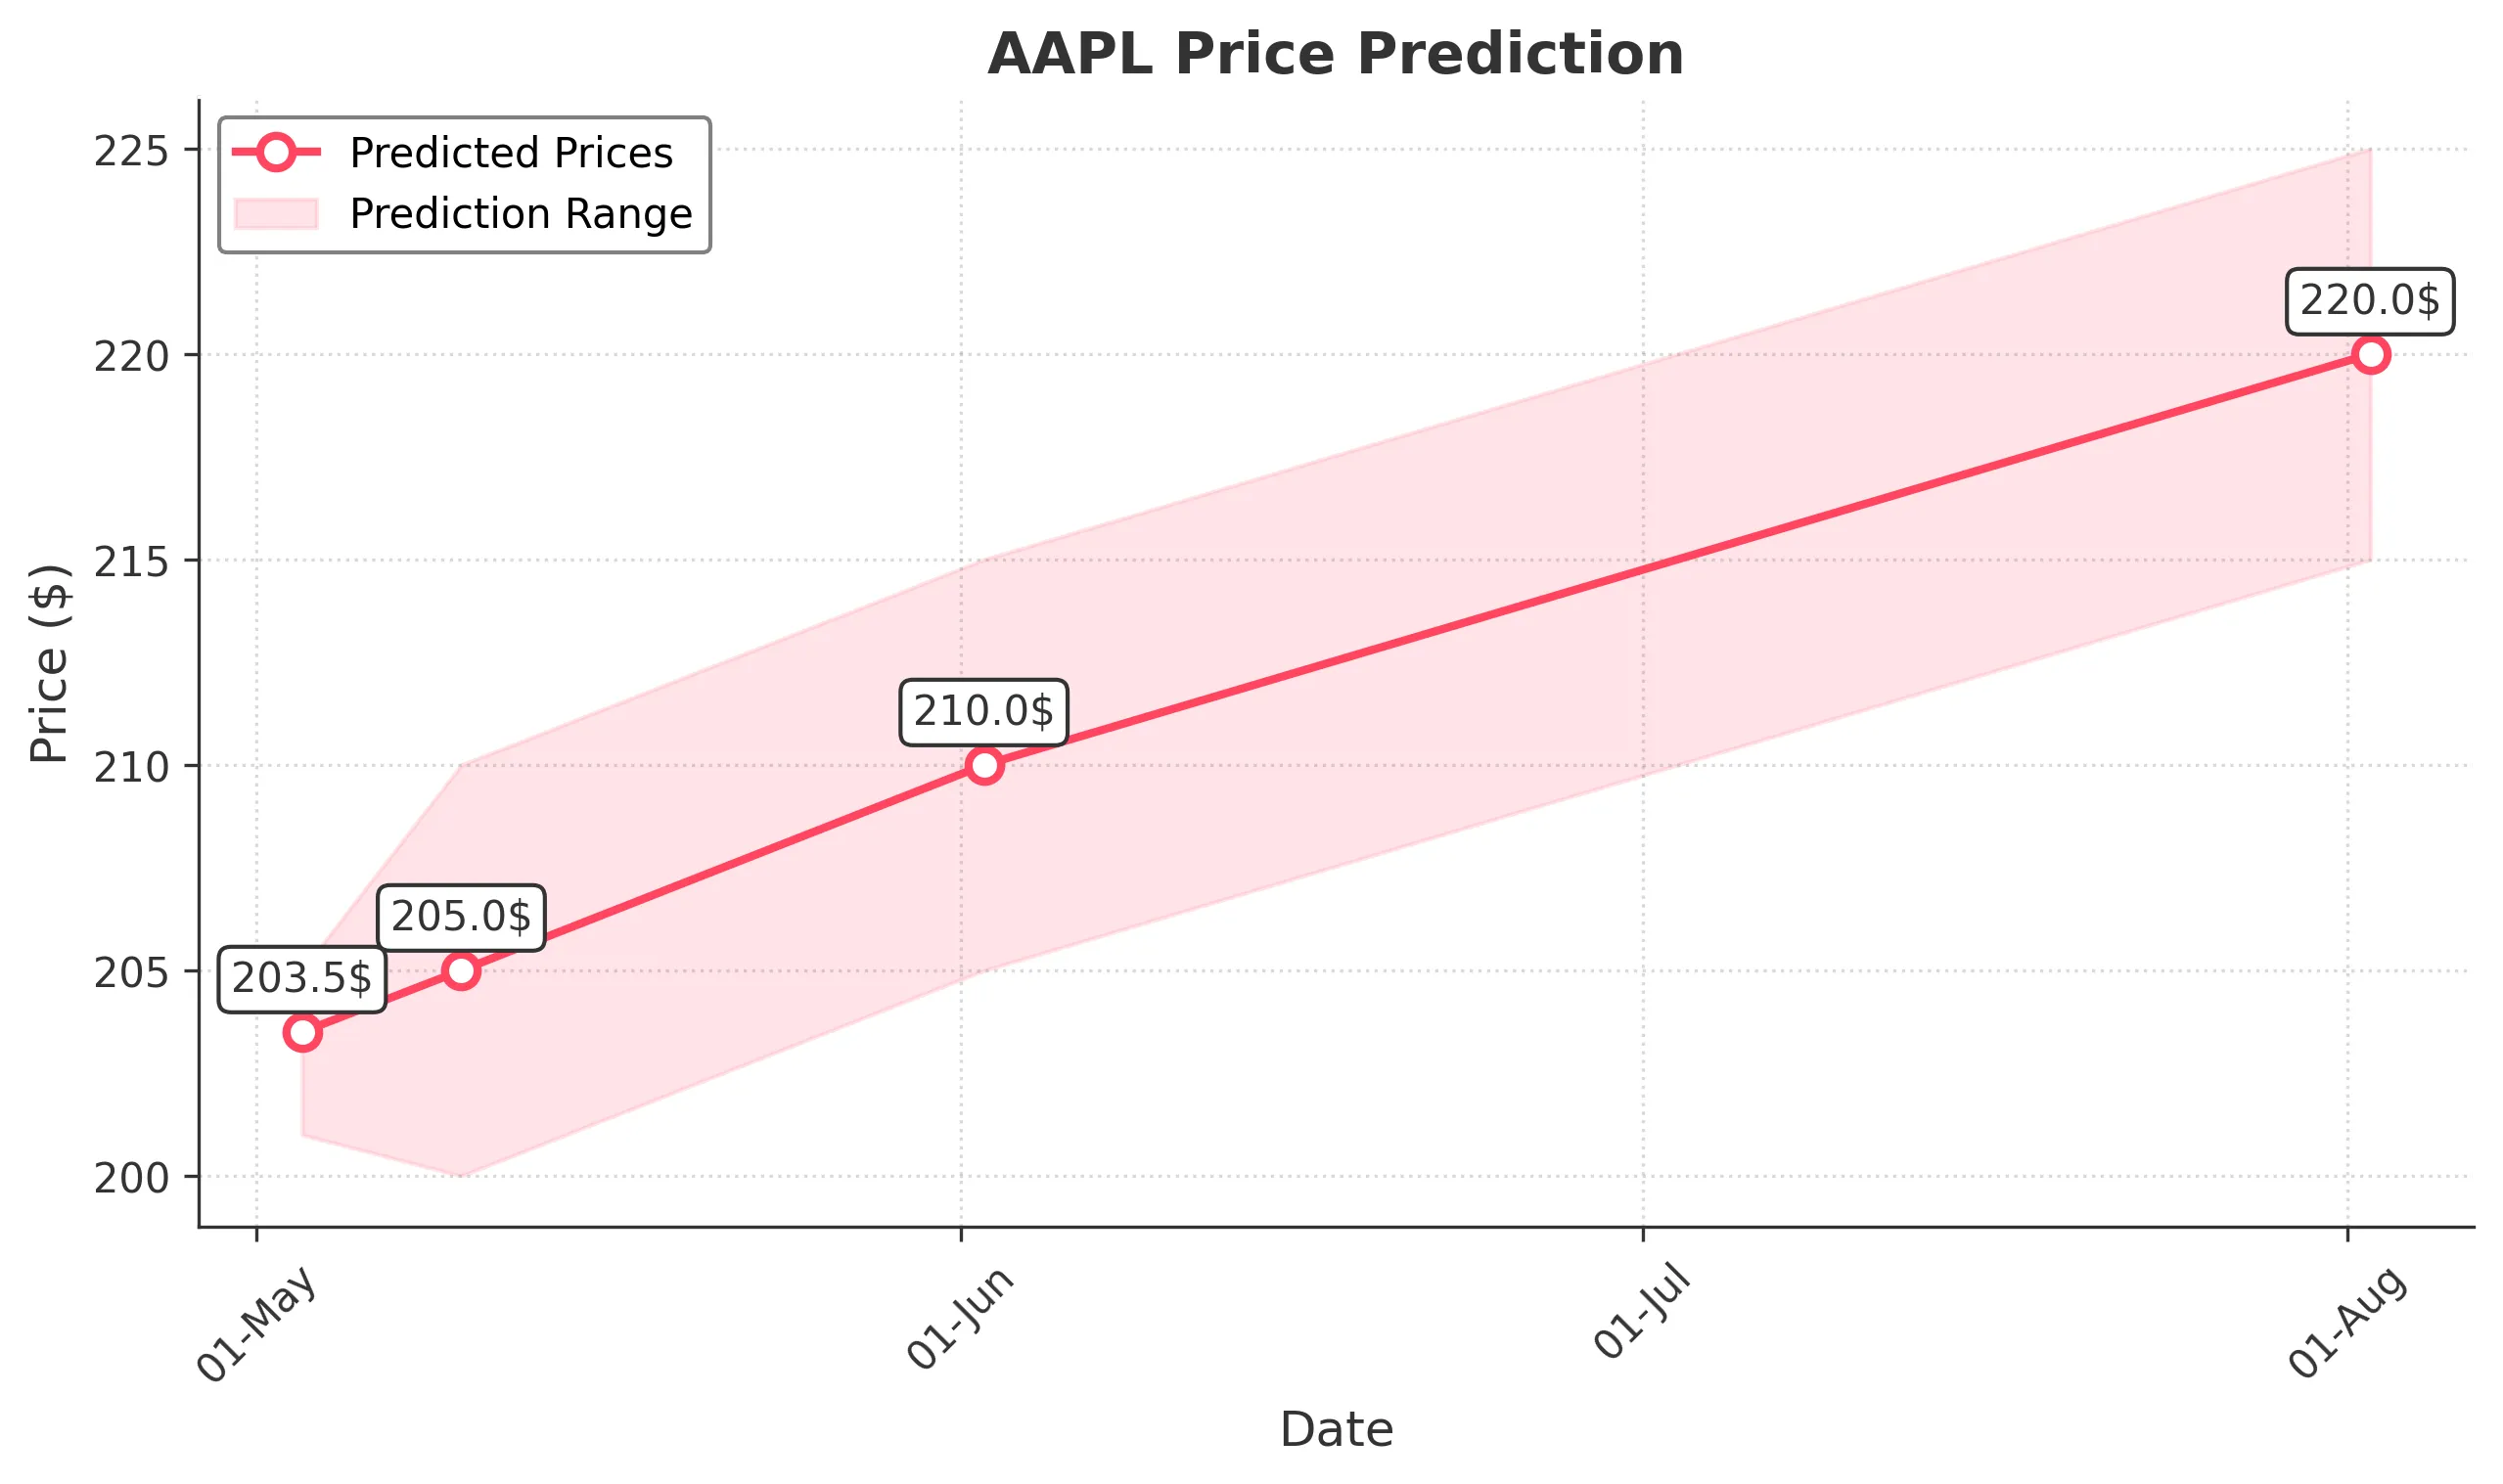
Target: May 3, 2025$203.5
$202.5
$205
$201
Description
AAPL shows bearish momentum with a recent drop in price and increased volatility. The RSI indicates oversold conditions, suggesting a potential short-term bounce. However, the MACD is bearish, indicating continued downward pressure.
Analysis
Over the past 3 months, AAPL has experienced significant volatility, with a bearish trend recently. Key support is around $200, while resistance is near $220. The MACD and RSI suggest bearish momentum, but volume spikes indicate potential reversals.
Confidence Level
Potential Risks
Market sentiment is volatile, and any unexpected news could lead to further declines or a reversal.
1 Week Prediction
Target: May 10, 2025$205
$203
$210
$200
Description
AAPL may see a slight recovery as it approaches key support levels. The RSI is improving, indicating potential bullish divergence. However, the overall trend remains bearish, and caution is advised.
Analysis
The stock has been in a bearish phase, with significant price drops. Support at $200 is critical, while resistance is at $220. The recent volume patterns suggest potential accumulation, but overall market sentiment remains cautious.
Confidence Level
Potential Risks
Continued bearish sentiment and macroeconomic factors could hinder recovery efforts.
1 Month Prediction
Target: June 2, 2025$210
$206
$215
$205
Description
AAPL may stabilize around $210 as it tests previous support levels. The MACD shows signs of potential bullish crossover, but the overall trend remains uncertain due to macroeconomic pressures.
Analysis
AAPL has faced downward pressure, with key support at $200 and resistance at $220. The stock's volatility has increased, and while there are signs of potential recovery, external factors could influence future performance.
Confidence Level
Potential Risks
Economic indicators and earnings reports could significantly impact stock performance.
3 Months Prediction
Target: August 2, 2025$220
$218
$225
$215
Description
If the market stabilizes, AAPL could recover to around $220. The RSI may indicate a bullish trend, but macroeconomic factors and earnings results will be crucial in determining the stock's trajectory.
Analysis
The stock has shown significant volatility, with a bearish trend recently. Key support at $200 and resistance at $220 are critical. The potential for recovery exists, but external economic factors and market sentiment will play a significant role.
Confidence Level
Potential Risks
Unforeseen market events or economic downturns could derail recovery efforts.