AAPL Trading Predictions
1 Day Prediction
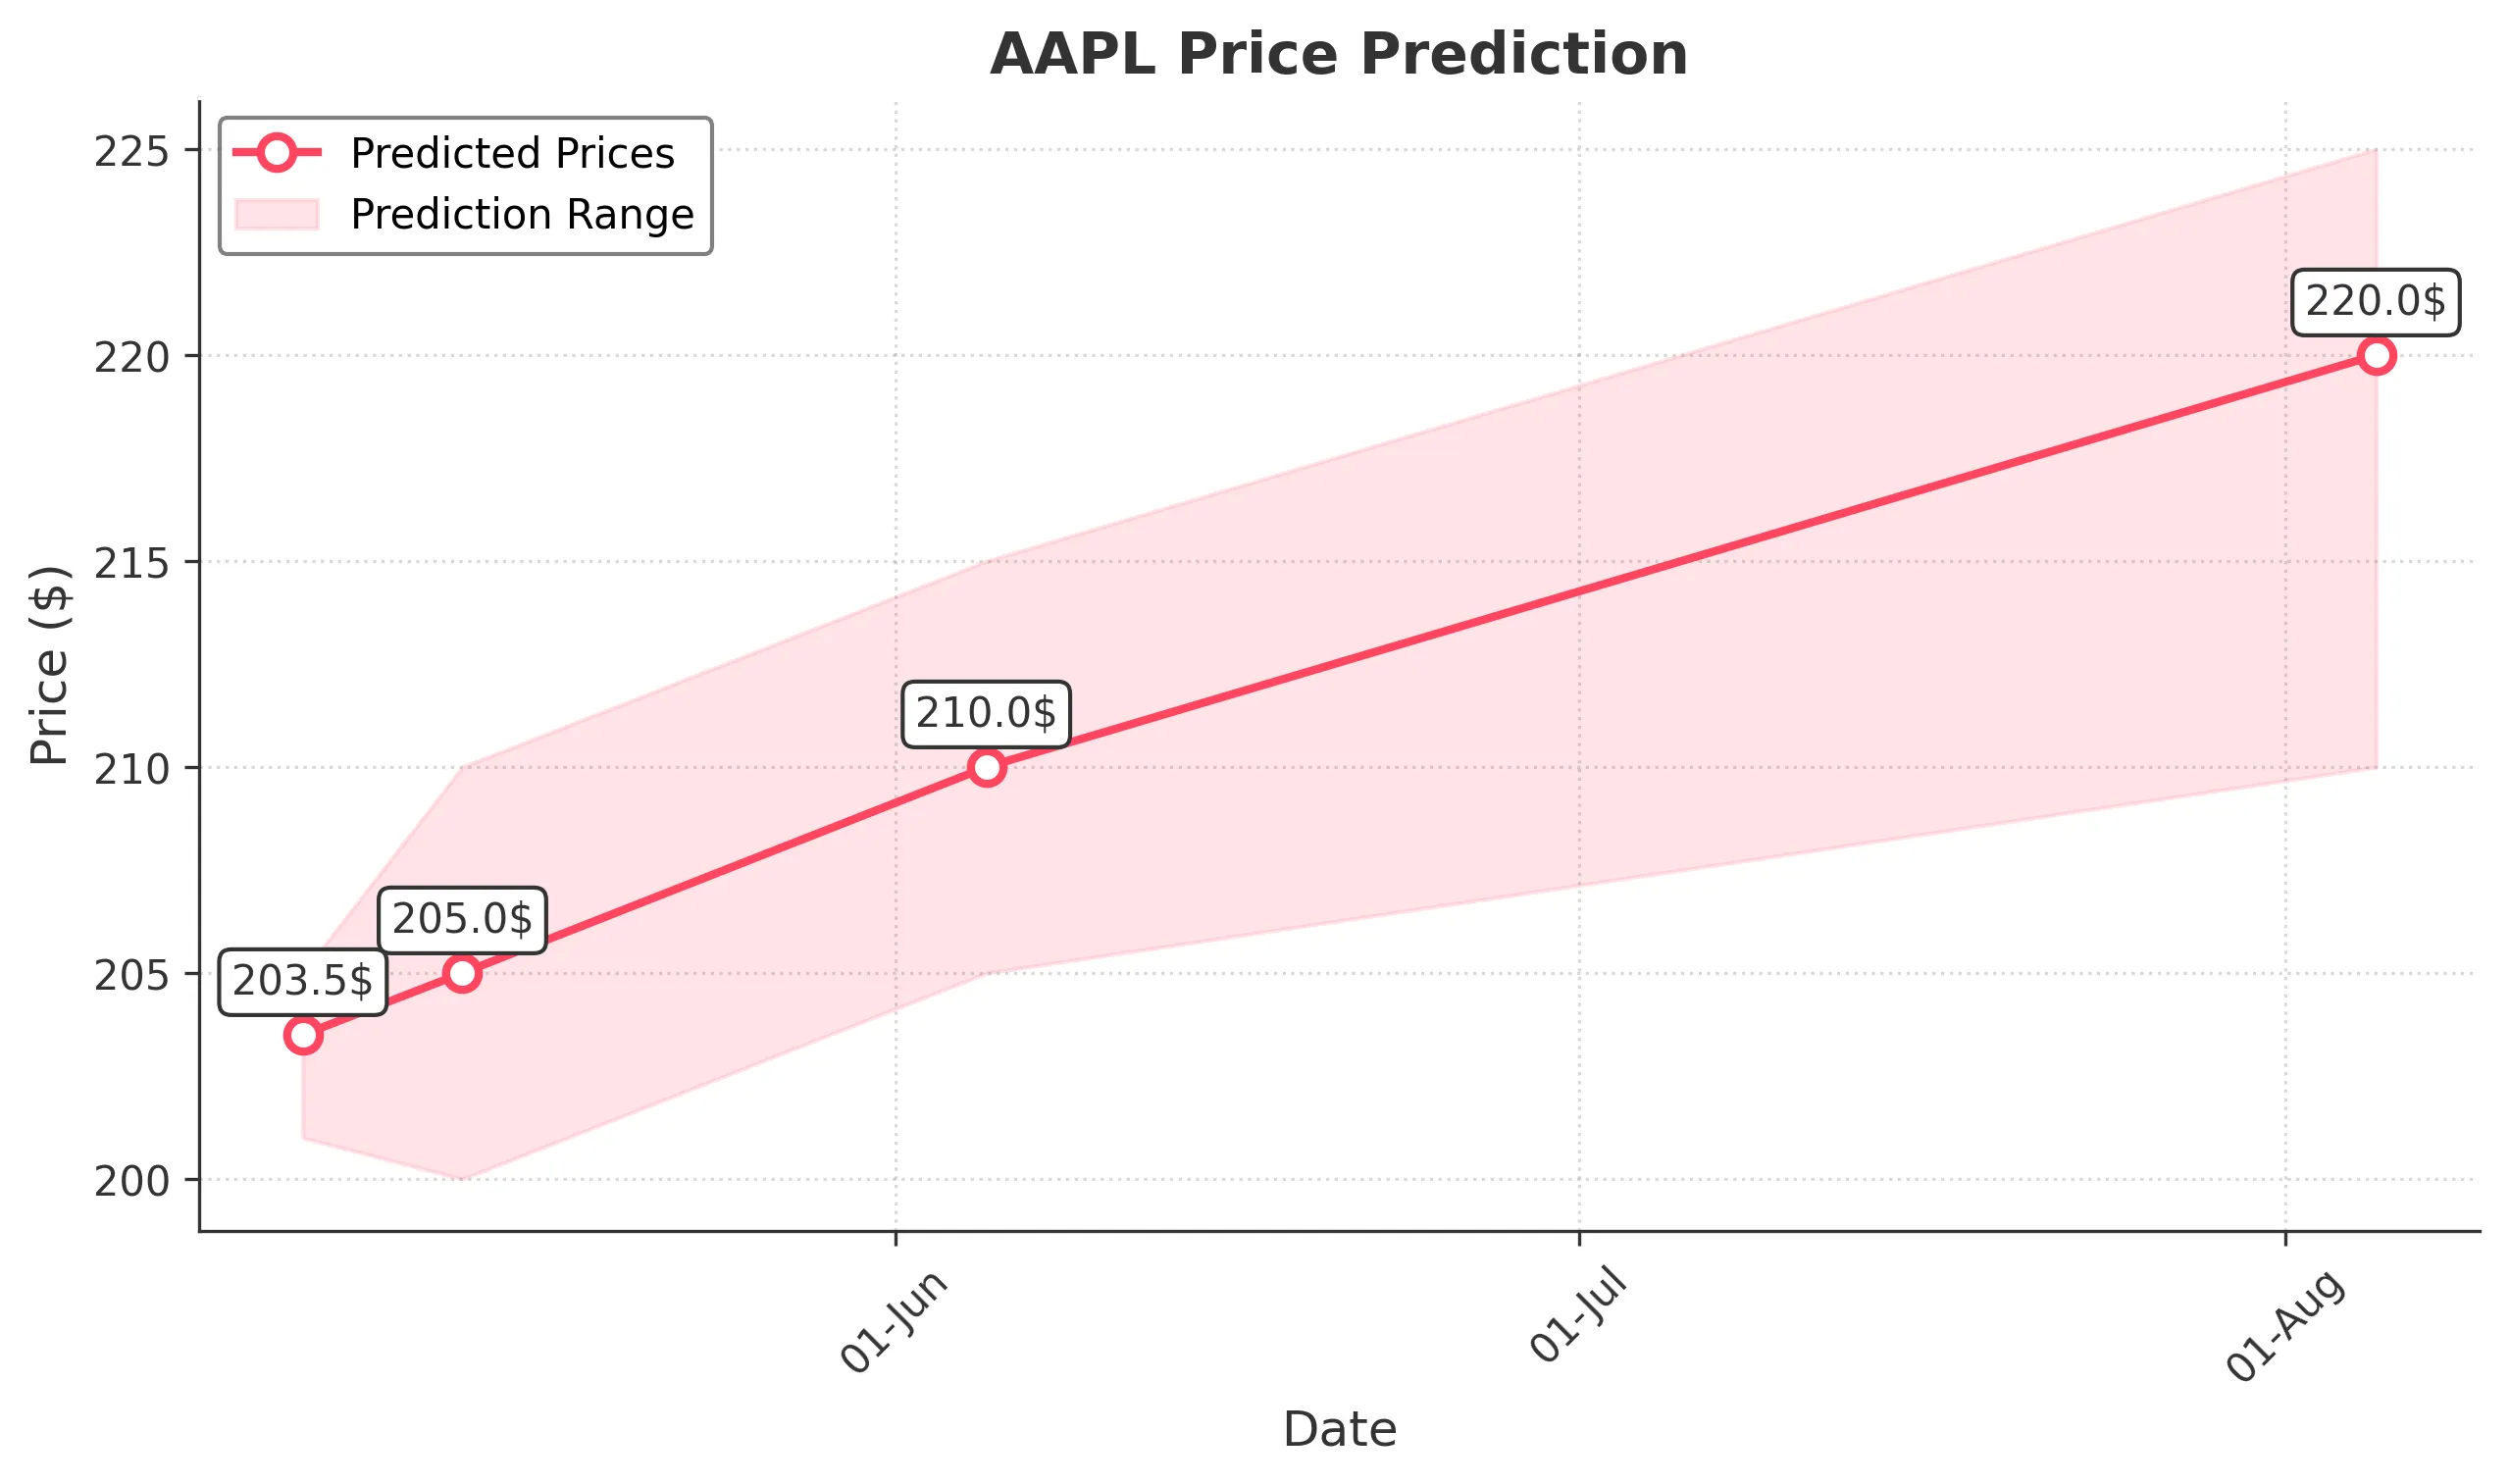
Target: May 6, 2025$203.5
$202.5
$205
$201
Description
AAPL shows bearish momentum with recent declines. The RSI indicates oversold conditions, suggesting a potential bounce. However, the MACD is bearish, and volume spikes indicate selling pressure. Expect a slight recovery but remain cautious.
Analysis
Over the past 3 months, AAPL has experienced significant volatility, with a bearish trend recently. Key support at $200 has been tested. The RSI is low, indicating potential for a bounce, but the MACD remains bearish. Volume spikes suggest selling pressure, and macroeconomic factors may influence future performance.
Confidence Level
Potential Risks
Market volatility and external news could impact the prediction. AAPL's recent downtrend raises concerns about further declines.
1 Week Prediction
Target: May 13, 2025$205
$203.5
$210
$200
Description
AAPL may stabilize around $205 as it tests support levels. The RSI is recovering, indicating potential bullish momentum. However, the MACD remains bearish, suggesting caution. Watch for volume trends to confirm direction.
Analysis
AAPL's performance has been bearish recently, with significant price drops. Support at $200 is critical. The RSI shows signs of recovery, but the MACD indicates bearish momentum. Volume patterns suggest selling pressure, and external factors could influence the stock's direction.
Confidence Level
Potential Risks
Uncertainty in market sentiment and potential macroeconomic news could lead to unexpected price movements.
1 Month Prediction
Target: June 5, 2025$210
$206
$215
$205
Description
AAPL may recover to $210 as it tests resistance levels. The RSI is improving, indicating bullish potential. However, the MACD remains a concern. Monitor volume for confirmation of upward momentum.
Analysis
AAPL has faced significant downward pressure, with key support at $200. The RSI is showing signs of recovery, but the MACD remains bearish. Volume patterns indicate selling pressure, and macroeconomic factors could influence future performance. A cautious approach is advised.
Confidence Level
Potential Risks
Market volatility and external news could impact the stock's recovery. The bearish trend may still prevail.
3 Months Prediction
Target: August 5, 2025$220
$215
$225
$210
Description
AAPL may trend upwards to $220 as it breaks resistance levels. The RSI is expected to stabilize, indicating bullish momentum. However, the MACD remains a concern. Watch for volume trends to confirm direction.
Analysis
AAPL's performance has been volatile, with significant price drops. Key support at $200 is critical. The RSI shows signs of recovery, but the MACD indicates bearish momentum. Volume patterns suggest selling pressure, and external factors could influence the stock's direction. A cautious approach is advised.
Confidence Level
Potential Risks
Potential market corrections and external economic factors could hinder recovery. The bearish trend may still impact performance.