AAPL Trading Predictions
1 Day Prediction
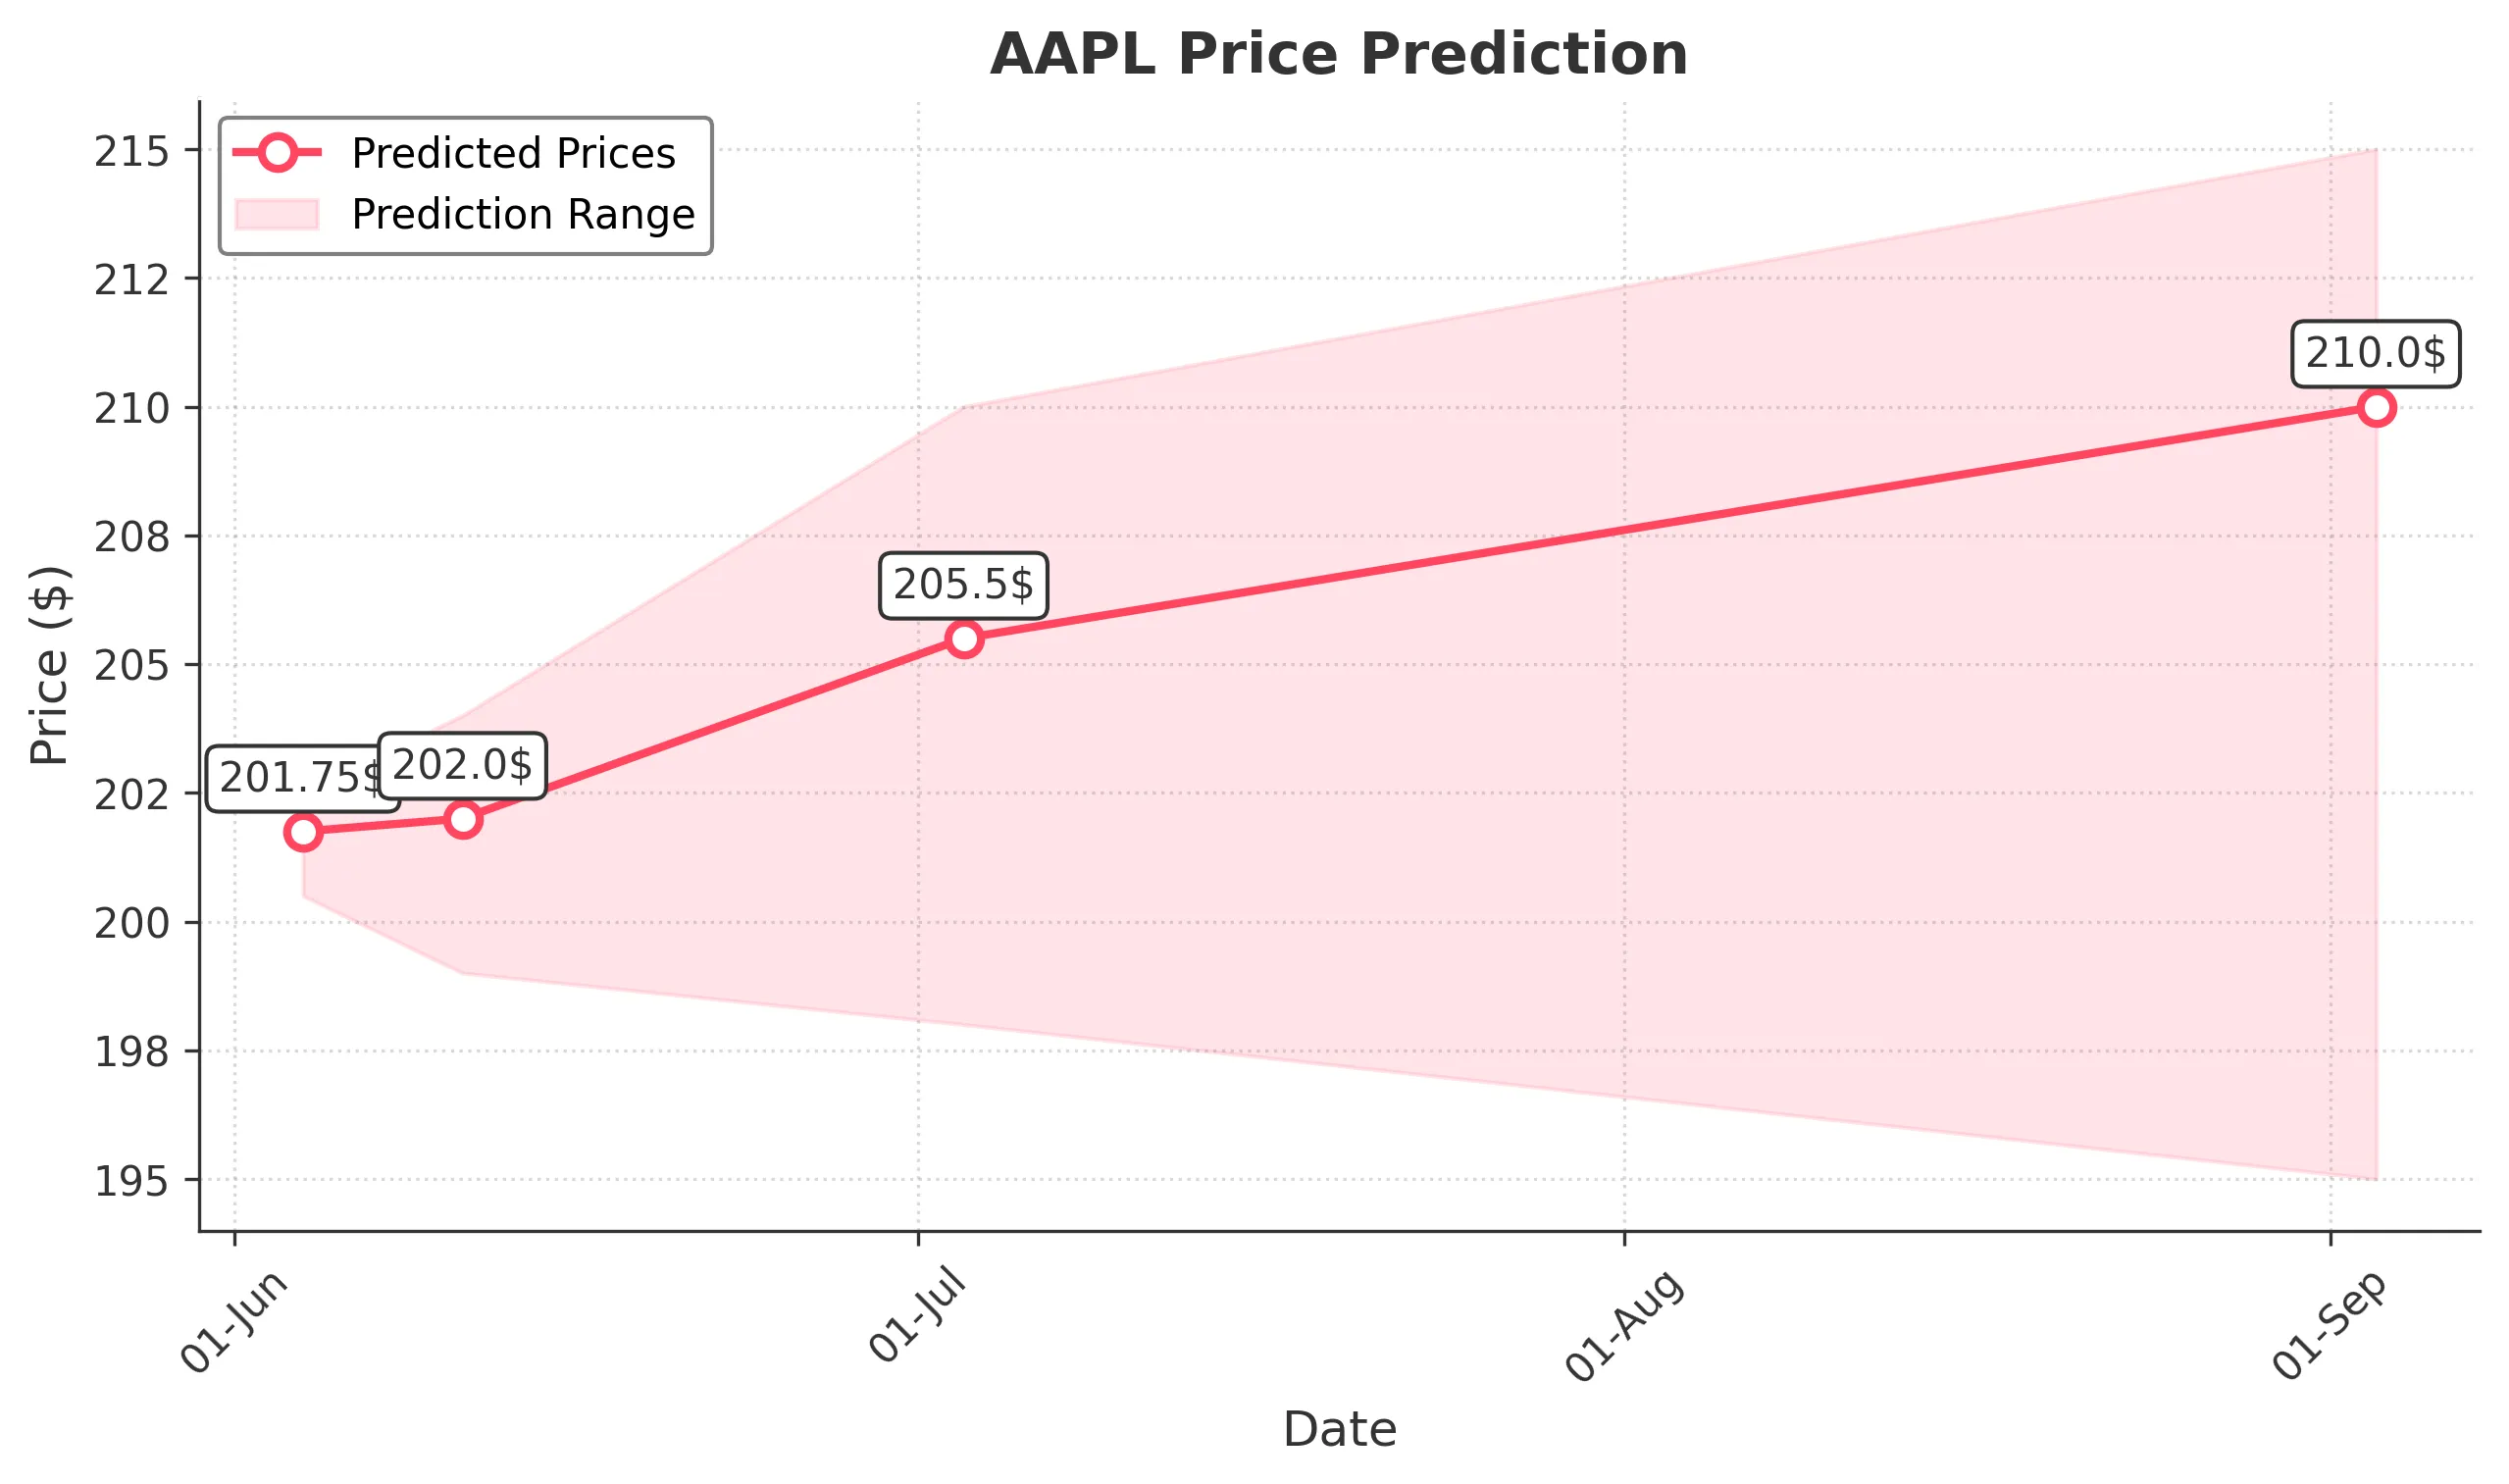
Target: June 4, 2025$201.75
$201.25
$202.5
$200.5
Description
AAPL shows a slight bullish trend with a recent Doji candlestick indicating indecision. The RSI is near neutral, suggesting potential for upward movement. However, recent volatility and lower volume may limit gains.
Analysis
Over the past 3 months, AAPL has experienced significant volatility, with a bearish trend recently. Key support at $200 has held, but resistance at $220 remains strong. The MACD shows a bearish crossover, indicating potential further declines.
Confidence Level
Potential Risks
Market sentiment is mixed, and external factors could lead to sudden price changes.
1 Week Prediction
Target: June 11, 2025$202
$201.5
$204
$199
Description
AAPL may stabilize around $202 as it tests support levels. The Bollinger Bands indicate potential for a bounce, but the MACD remains bearish. Volume trends suggest cautious trading ahead.
Analysis
The stock has shown a bearish trend with significant volume spikes during sell-offs. Support at $200 is critical, while resistance at $220 looms. The ATR indicates increased volatility, suggesting potential for sharp price movements.
Confidence Level
Potential Risks
Unforeseen market news or earnings reports could impact stock performance significantly.
1 Month Prediction
Target: July 3, 2025$205.5
$204
$210
$198
Description
AAPL may recover slightly as it approaches key Fibonacci retracement levels. The RSI indicates oversold conditions, suggesting a potential rebound. However, macroeconomic factors could hinder growth.
Analysis
The stock has been in a bearish phase, with significant resistance at $210. Recent trading patterns show a potential for recovery, but the overall market sentiment remains cautious. Volume analysis indicates a lack of strong buying interest.
Confidence Level
Potential Risks
Economic indicators and market sentiment could lead to unexpected volatility.
3 Months Prediction
Target: September 3, 2025$210
$208
$215
$195
Description
AAPL may trend upwards as it approaches the end of Q3, supported by seasonal trends. However, the MACD indicates potential bearish divergence, suggesting caution. Market conditions will be crucial.
Analysis
The stock has shown a bearish trend recently, with significant support at $200. The overall market sentiment is mixed, and while there are signs of recovery, external factors could lead to further declines. Key resistance remains at $215.
Confidence Level
Potential Risks
Potential economic downturns or changes in consumer sentiment could adversely affect stock performance.