AAPL Trading Predictions
1 Day Prediction
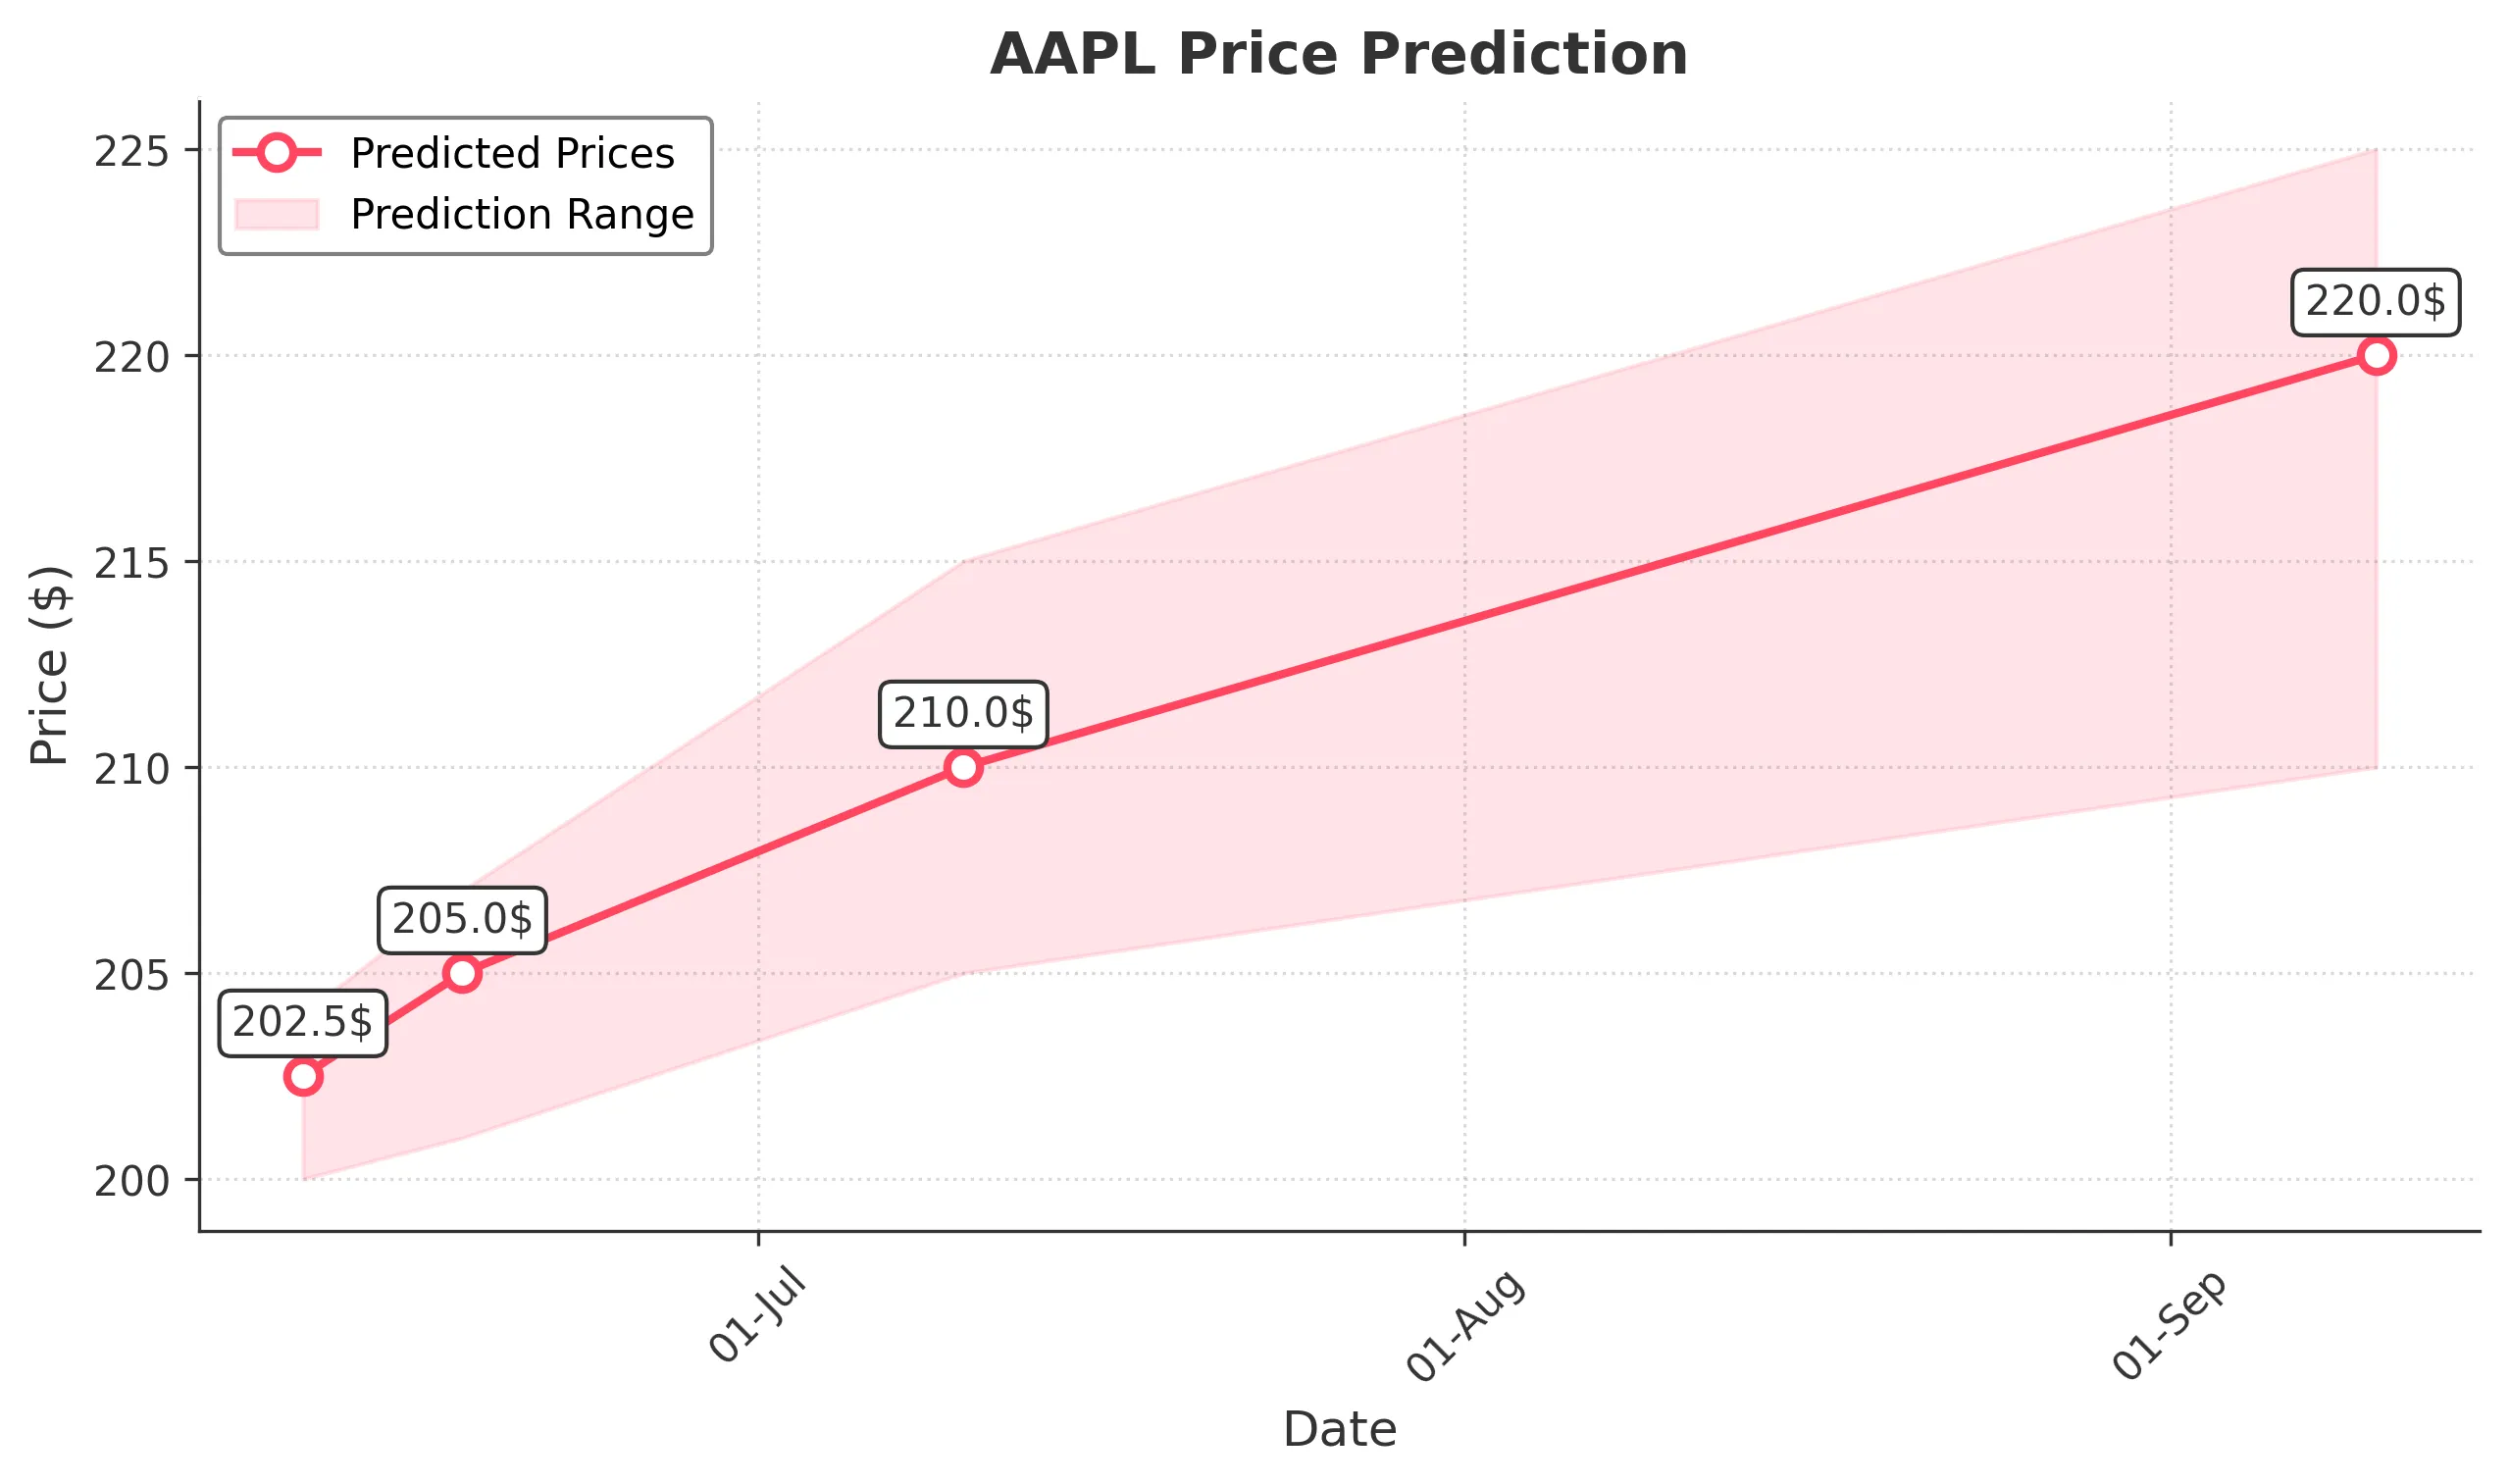
Target: June 11, 2025$202.5
$201
$204
$200
Description
The stock shows a slight bullish trend with a potential close around 202.50. The RSI is neutral, and MACD indicates a potential upward momentum. However, recent volatility suggests caution.
Analysis
Over the past 3 months, AAPL has shown a bearish trend with significant volatility. Key support at 200.00 and resistance at 210.00. Recent volume spikes indicate increased interest, but overall sentiment remains cautious.
Confidence Level
Potential Risks
Market sentiment could shift due to external news or earnings reports, impacting the prediction.
1 Week Prediction
Target: June 18, 2025$205
$202.5
$207
$201
Description
AAPL is expected to recover slightly, closing around 205.00. The Bollinger Bands suggest a potential breakout, but the MACD remains bearish. Watch for volume trends to confirm direction.
Analysis
The stock has been in a bearish phase, with significant resistance at 210.00. Recent candlestick patterns show indecision, and the ATR indicates high volatility. Volume analysis suggests cautious trading.
Confidence Level
Potential Risks
Potential for reversal exists if market sentiment shifts negatively or if macroeconomic factors come into play.
1 Month Prediction
Target: July 10, 2025$210
$206
$215
$205
Description
AAPL may trend upwards to 210.00 as it approaches key Fibonacci retracement levels. The RSI indicates potential bullish divergence, but caution is advised due to recent volatility.
Analysis
The stock has shown a mix of bullish and bearish signals. Key support at 200.00 and resistance at 215.00. Volume patterns indicate increased interest, but overall market sentiment remains uncertain.
Confidence Level
Potential Risks
Unforeseen market events or earnings reports could significantly impact the stock's trajectory.
3 Months Prediction
Target: September 10, 2025$220
$215
$225
$210
Description
AAPL is projected to recover to 220.00, driven by potential positive earnings and market sentiment. The MACD may turn bullish, but watch for resistance at 225.00.
Analysis
The stock has been volatile, with a bearish trend recently. Key resistance at 225.00 and support at 200.00. Technical indicators show mixed signals, and external factors could heavily influence future performance.
Confidence Level
Potential Risks
Long-term predictions are subject to macroeconomic changes and market volatility, which could alter the outlook.