AAPL Trading Predictions
1 Day Prediction
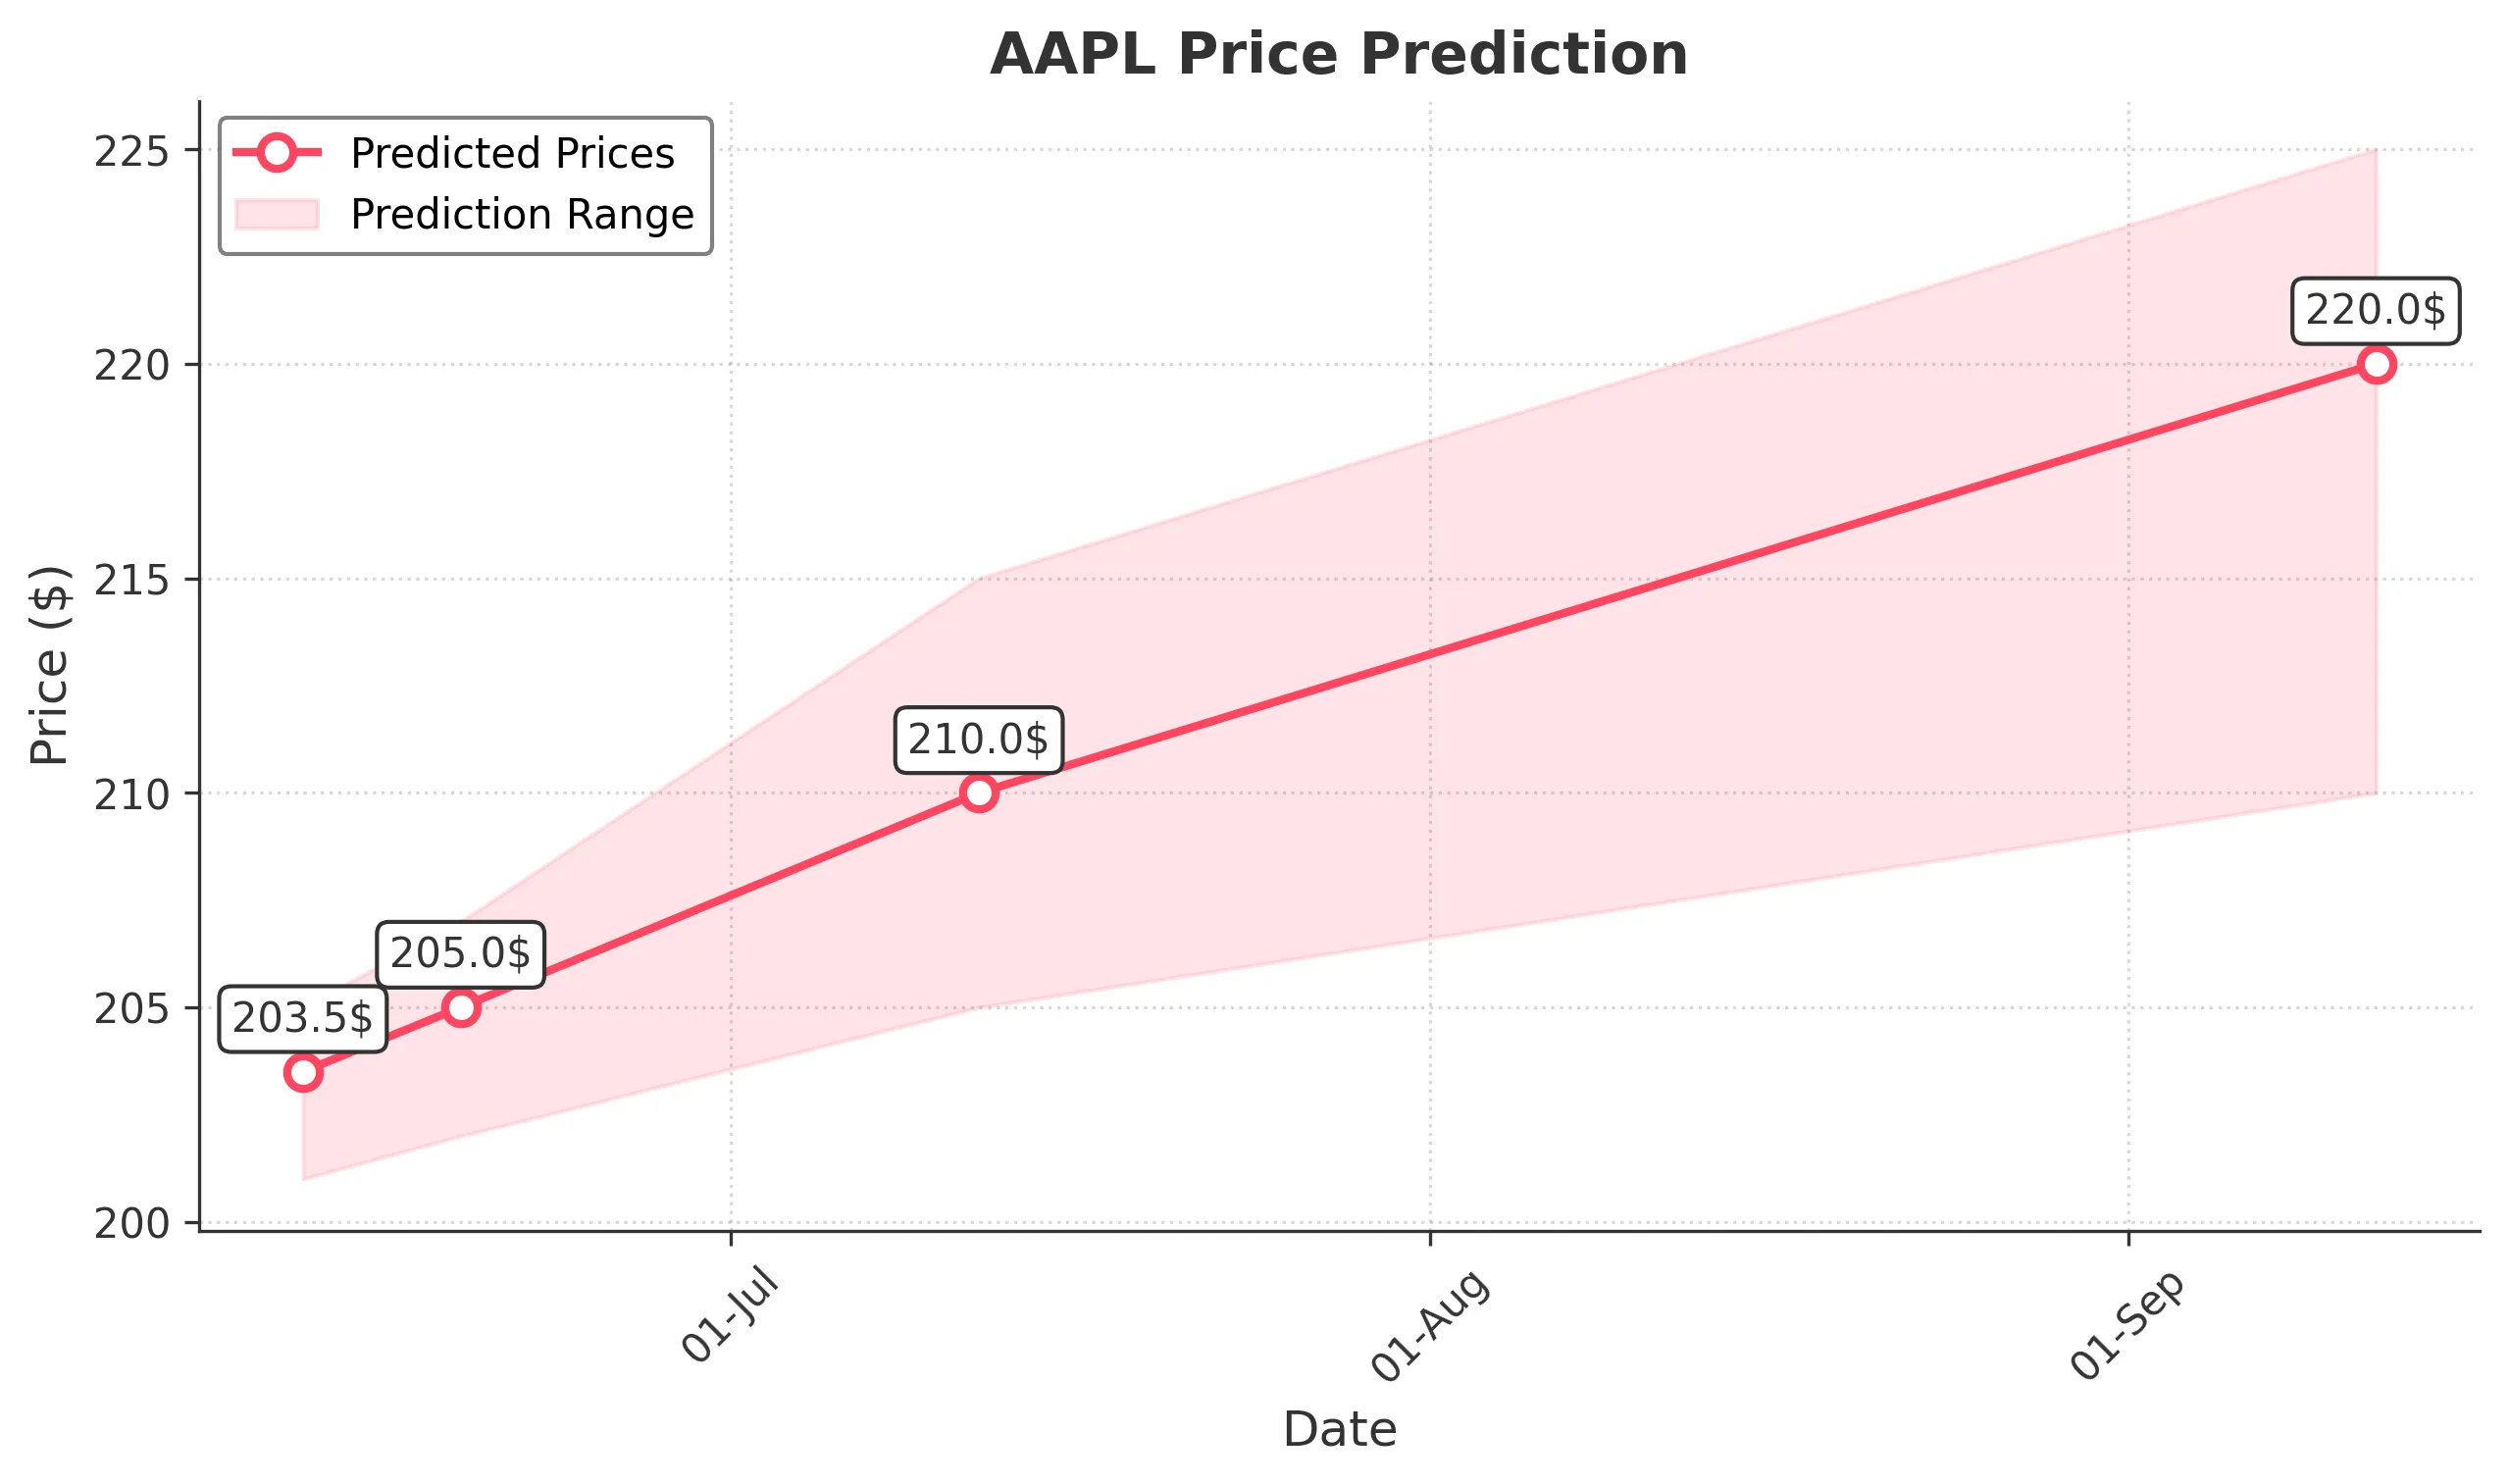
Target: June 12, 2025$203.5
$202.5
$205
$201
Description
AAPL shows a slight bullish trend with a recent Doji candlestick indicating indecision. The RSI is neutral, and MACD is close to crossing above the signal line, suggesting potential upward momentum. However, recent volatility may lead to fluctuations.
Analysis
Over the past 3 months, AAPL has experienced significant volatility, with a bearish trend recently. Key support at $200 and resistance at $220. The RSI indicates potential oversold conditions, while volume spikes suggest increased interest. Overall, the outlook remains cautious.
Confidence Level
Potential Risks
Market sentiment could shift due to macroeconomic news or earnings reports, which may impact the stock's performance.
1 Week Prediction
Target: June 19, 2025$205
$204
$207
$202
Description
The stock may recover slightly as it approaches a Fibonacci retracement level at $205. The MACD shows signs of bullish divergence, and the RSI is improving. However, external factors could still lead to downward pressure.
Analysis
AAPL has been in a bearish phase, with significant price drops. The recent price action shows a potential reversal, but the overall trend remains uncertain. Key support at $200 and resistance at $210. Volume analysis indicates mixed sentiment.
Confidence Level
Potential Risks
Potential market corrections or negative news could reverse the upward trend, impacting the prediction.
1 Month Prediction
Target: July 12, 2025$210
$206
$215
$205
Description
AAPL may stabilize around $210 as it approaches a critical resistance level. The RSI is expected to trend upwards, and MACD may confirm bullish momentum. However, macroeconomic factors could still introduce volatility.
Analysis
The stock has shown a bearish trend recently, but signs of recovery are emerging. Key support at $200 and resistance at $215. The volume has been inconsistent, indicating uncertainty in market sentiment. A balanced view is necessary.
Confidence Level
Potential Risks
Economic indicators and earnings reports could lead to unexpected price movements, affecting the prediction's accuracy.
3 Months Prediction
Target: September 12, 2025$220
$215
$225
$210
Description
If the bullish trend continues, AAPL could reach $220, supported by positive earnings and market sentiment. The MACD may confirm a bullish crossover, and RSI could indicate overbought conditions. However, external shocks could derail this.
Analysis
AAPL's performance has been volatile, with a recent bearish trend. Key support at $200 and resistance at $225. The stock's future performance will depend on broader market conditions and company-specific news. A cautious approach is warranted.
Confidence Level
Potential Risks
Unforeseen market events or economic downturns could significantly impact the stock's trajectory, leading to potential declines.