AAPL Trading Predictions
1 Day Prediction
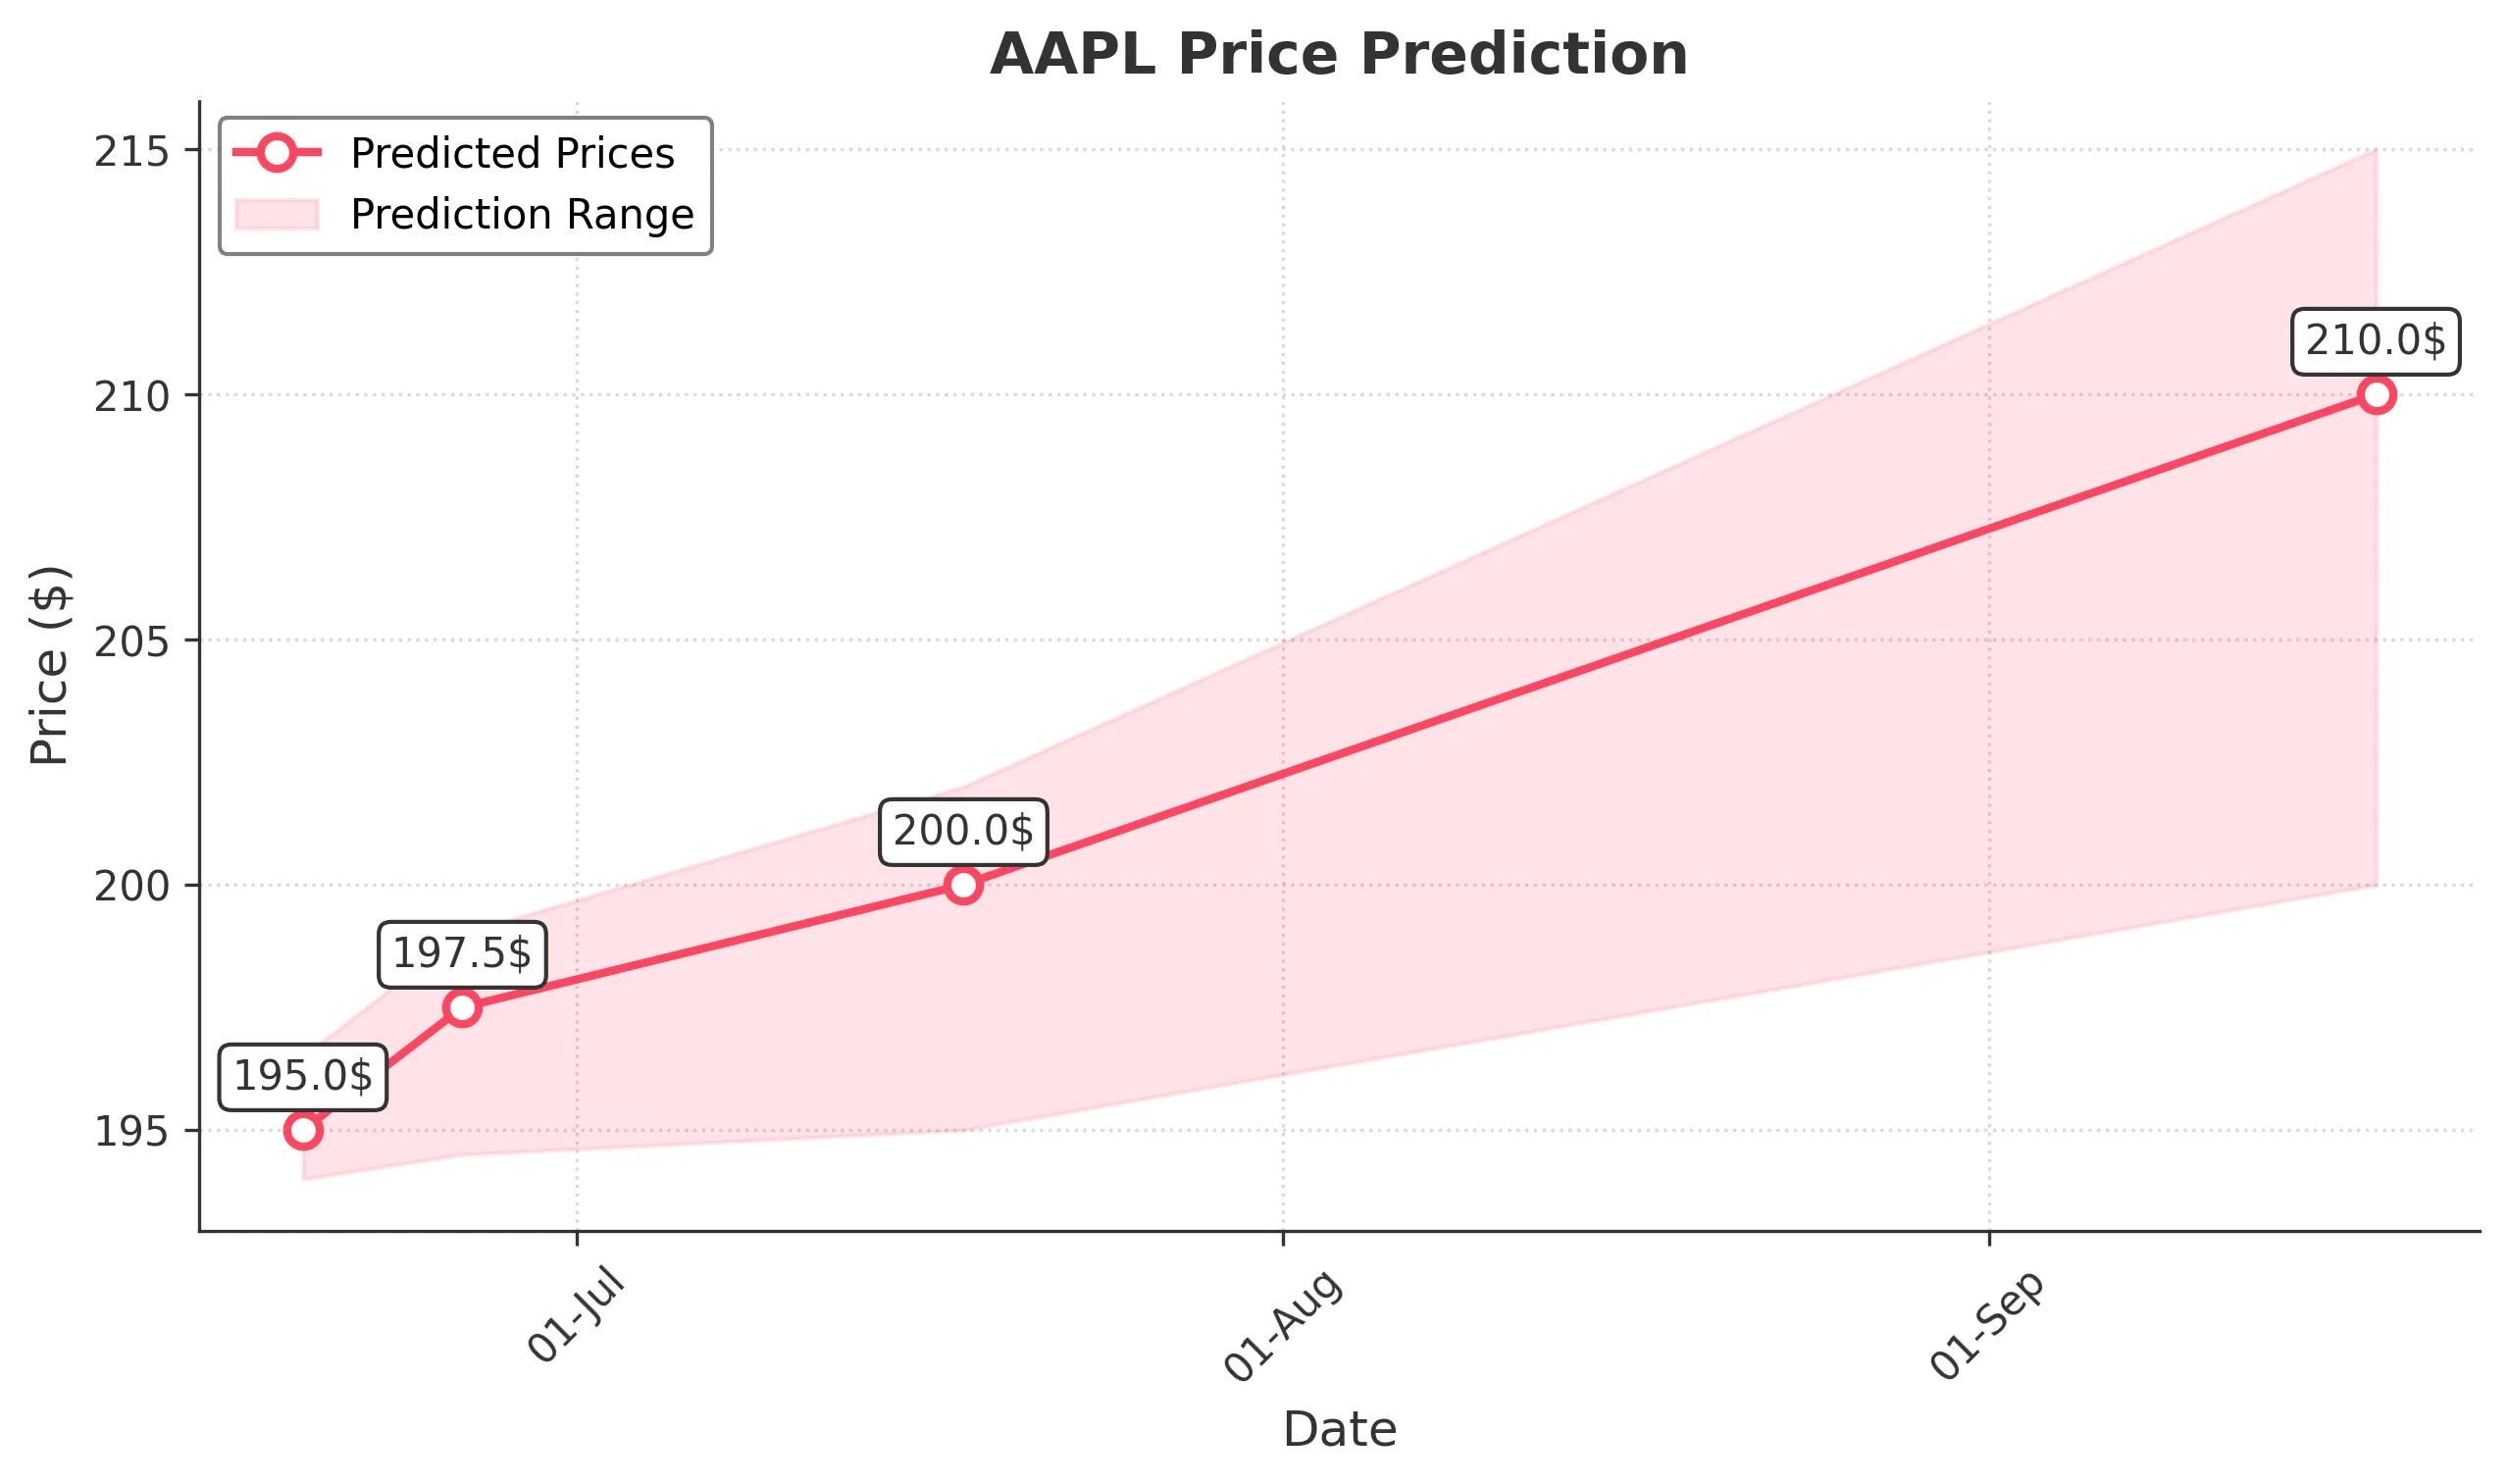
Target: June 19, 2025$195
$195.5
$196.5
$194
Description
AAPL shows bearish momentum with recent lower closes and a potential support level around 195. The RSI indicates oversold conditions, suggesting a possible short-term bounce. However, market sentiment remains cautious due to recent volatility.
Analysis
Over the past 3 months, AAPL has experienced significant volatility, with a bearish trend recently. Key support is around 195, while resistance is near 200. The RSI is low, indicating potential for a bounce, but MACD shows bearish divergence. Volume spikes during sell-offs suggest strong selling pressure.
Confidence Level
Potential Risks
Market volatility and external news could impact the prediction. A reversal pattern could emerge if bullish sentiment returns.
1 Week Prediction
Target: June 26, 2025$197.5
$196
$199
$194.5
Description
AAPL may recover slightly as it approaches a key support level. The Bollinger Bands indicate potential for a bounce, but the overall trend remains bearish. Watch for volume spikes that could signal a reversal.
Analysis
The stock has been in a bearish phase, with significant selling pressure. Support at 195 is critical, while resistance is at 200. The ATR indicates high volatility, and recent candlestick patterns suggest indecision. Volume analysis shows increased selling, which could continue to weigh on prices.
Confidence Level
Potential Risks
Uncertainty in market conditions and potential negative news could hinder recovery. A failure to hold support could lead to further declines.
1 Month Prediction
Target: July 18, 2025$200
$198
$202
$195
Description
AAPL may stabilize around 200 as it tests resistance. The RSI could recover, indicating a potential bullish reversal. However, macroeconomic factors and earnings reports could influence the price direction.
Analysis
The stock has shown a bearish trend but may find support around 195. The MACD is nearing a crossover, which could signal a potential reversal. Volume patterns indicate selling pressure, but a recovery could occur if market sentiment improves. Key resistance is at 200.
Confidence Level
Potential Risks
Earnings reports and macroeconomic data could lead to unexpected volatility. A failure to break resistance could result in further declines.
3 Months Prediction
Target: September 18, 2025$210
$205
$215
$200
Description
AAPL could recover to 210 as market conditions stabilize. Positive earnings and product launches may drive sentiment. However, external economic factors could pose risks.
Analysis
The stock has been volatile, with a bearish trend recently. Key support is at 195, while resistance is at 200. The market sentiment is cautious, and external factors could influence price movements. A potential recovery hinges on positive news and market conditions.
Confidence Level
Potential Risks
Macroeconomic uncertainties and competitive pressures could impact performance. A failure to meet earnings expectations could lead to declines.