AAPL Trading Predictions
1 Day Prediction
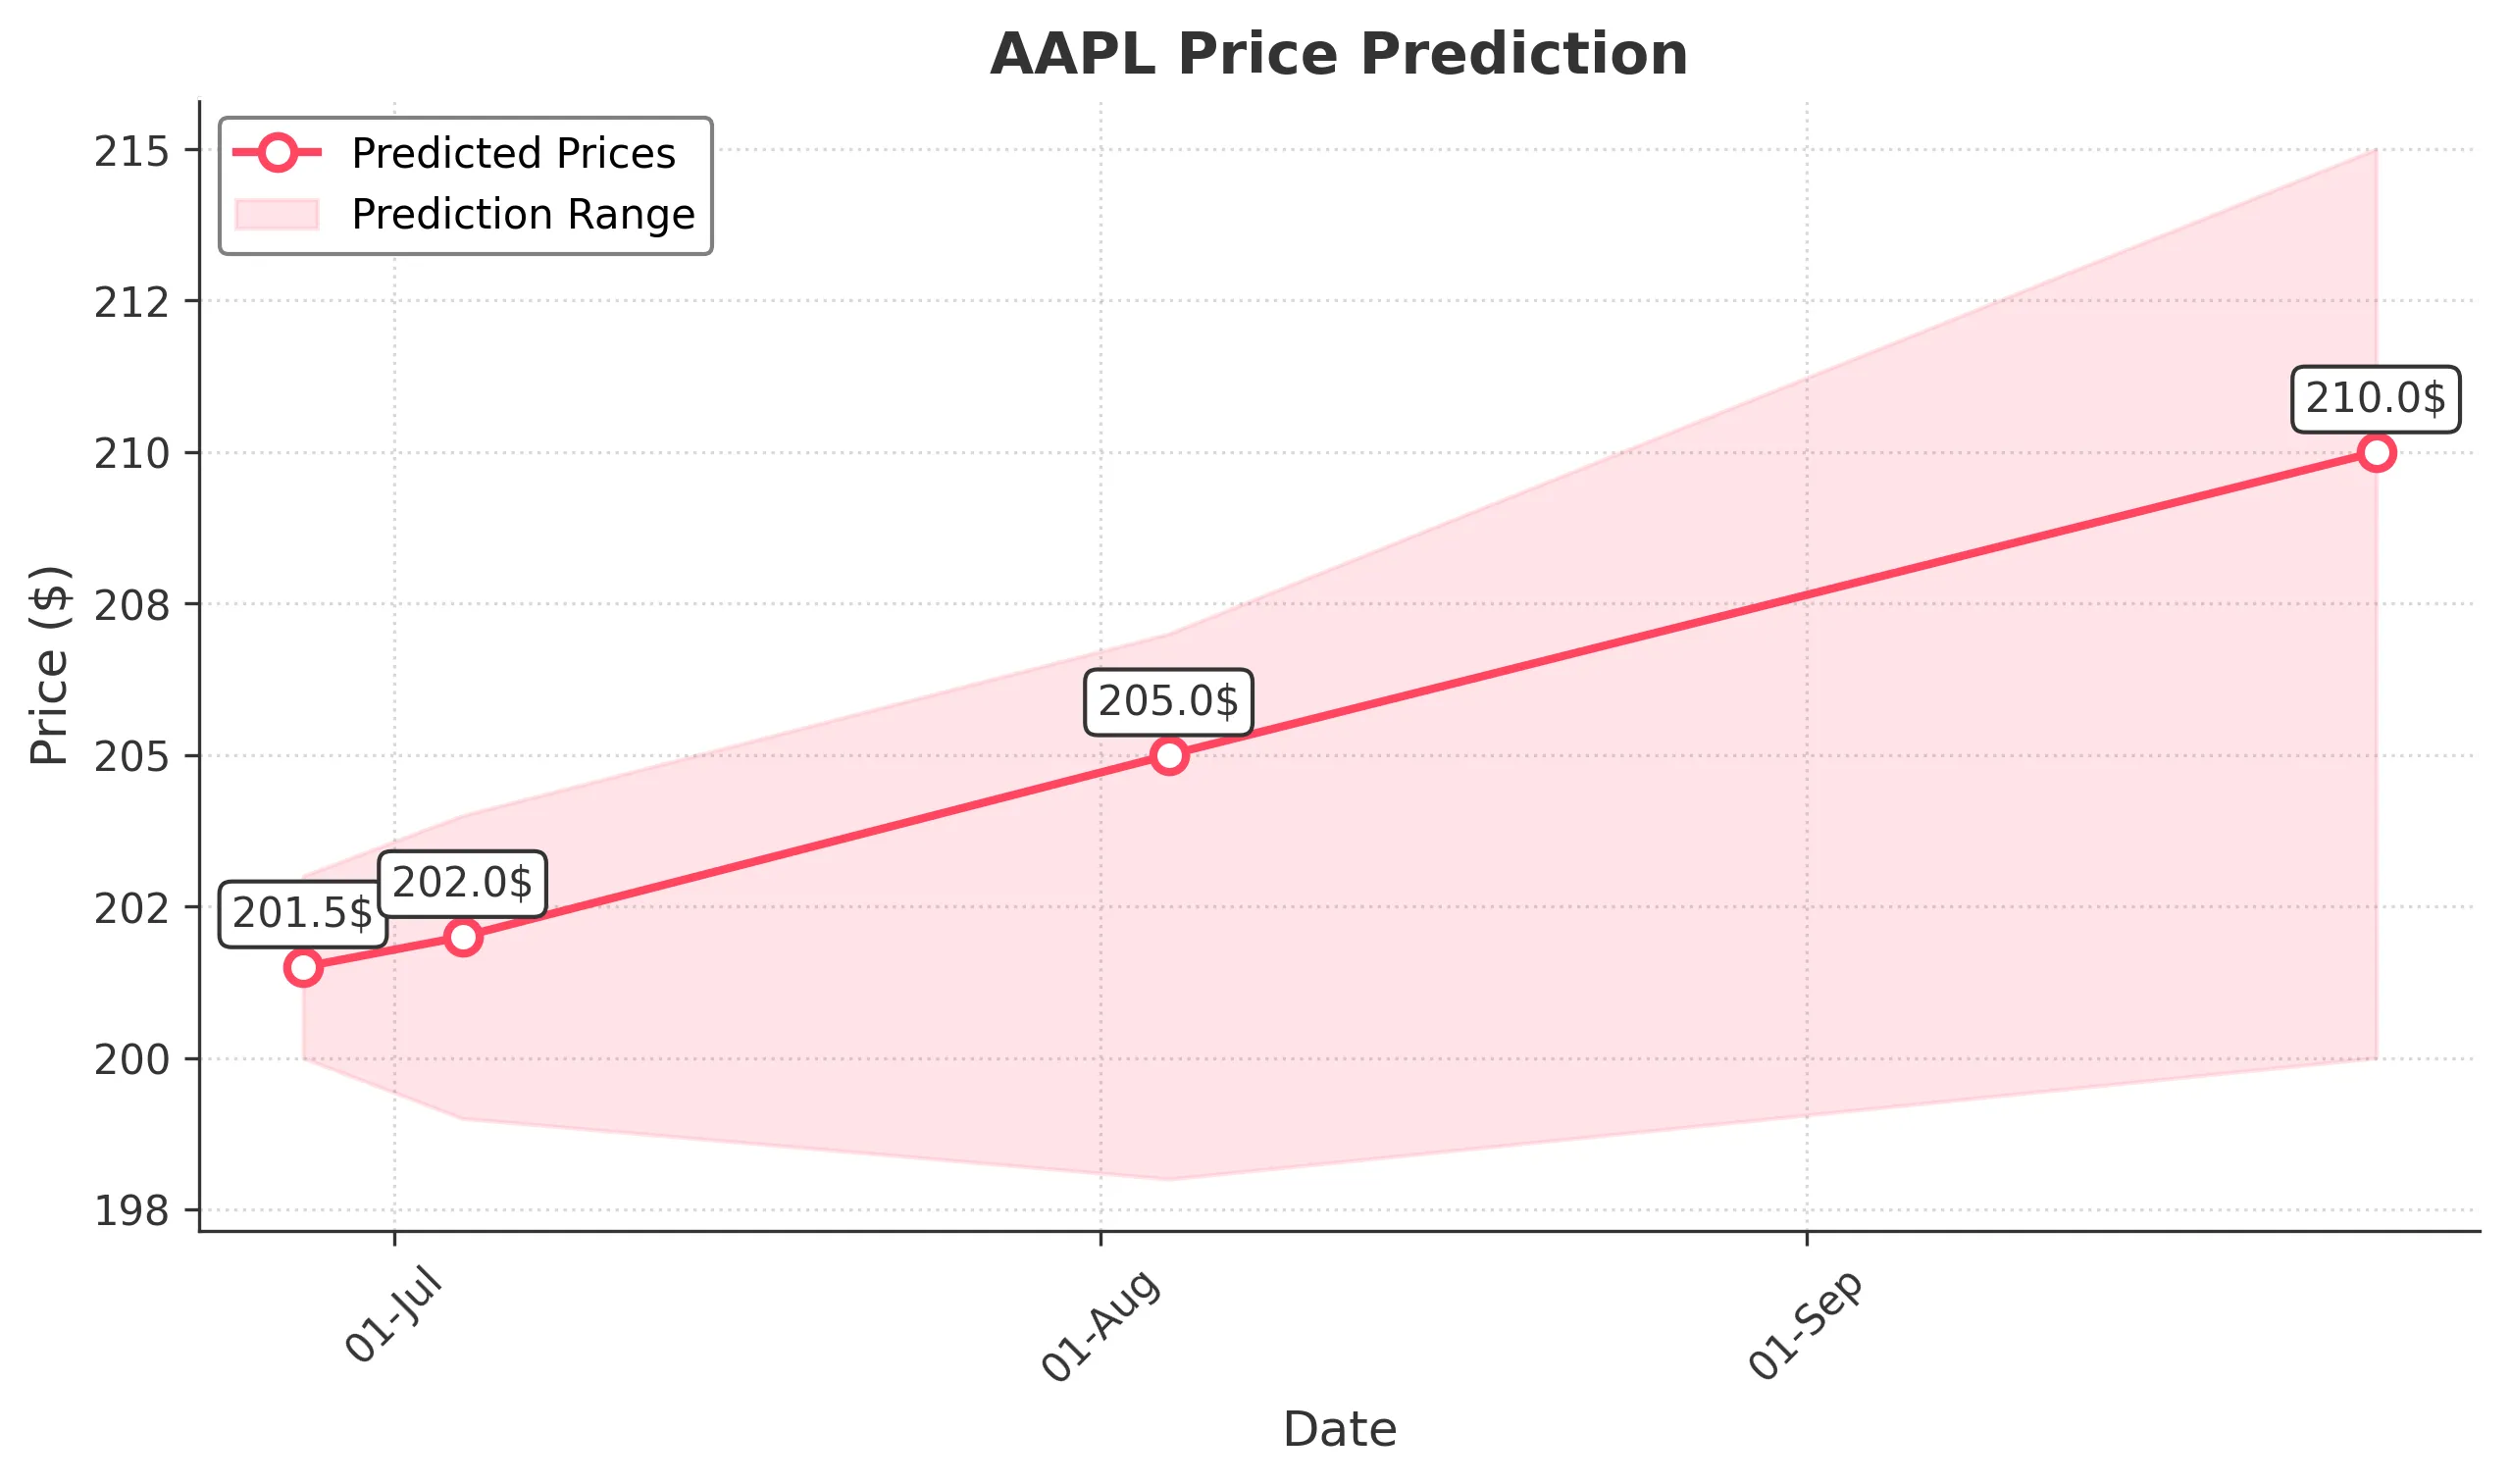
Target: June 27, 2025$201.5
$201
$203
$200
Description
AAPL shows a slight bullish trend with a potential close around 201.5. The recent candlestick patterns indicate indecision, but the RSI is neutral, suggesting a possible upward move. Volume is expected to remain moderate.
Analysis
Over the past 3 months, AAPL has experienced significant volatility, with a bearish trend recently. Key support is around 200, while resistance is near 203. The MACD shows a bearish crossover, and the RSI is neutral, indicating indecision. Volume spikes were noted during sell-offs, suggesting caution.
Confidence Level
Potential Risks
Market volatility and external news could impact the price. A bearish reversal is possible if selling pressure increases.
1 Week Prediction
Target: July 4, 2025$202
$201.5
$204
$199
Description
AAPL is expected to close around 202.0 next week, supported by a potential bounce from the 200 level. The Bollinger Bands indicate a squeeze, suggesting a breakout could occur. However, the MACD remains bearish.
Analysis
The stock has shown a bearish trend recently, with significant support at 200. The RSI is approaching oversold territory, indicating a potential rebound. Volume has been inconsistent, with spikes during sell-offs. Overall, the market sentiment is cautious.
Confidence Level
Potential Risks
Unforeseen macroeconomic events or earnings reports could lead to increased volatility, impacting the prediction.
1 Month Prediction
Target: August 4, 2025$205
$202.5
$207
$198
Description
In one month, AAPL may reach around 205.0, as it attempts to recover from recent lows. The Fibonacci retracement levels suggest resistance at 207, while support remains at 200. The market sentiment could shift positively if earnings exceed expectations.
Analysis
AAPL has been in a bearish phase, but signs of recovery are emerging. The MACD is showing potential bullish divergence, and the RSI is improving. Key resistance is at 207, while support at 200 remains critical. Volume patterns indicate cautious trading.
Confidence Level
Potential Risks
Economic indicators and market sentiment shifts could lead to unexpected price movements.
3 Months Prediction
Target: September 26, 2025$210
$205
$215
$200
Description
Three months from now, AAPL could close around 210.0, assuming a recovery trend continues. The technical indicators suggest a potential bullish reversal, but macroeconomic factors could influence this trajectory.
Analysis
The stock has shown volatility with a bearish trend recently. However, if the market sentiment improves, AAPL could see a recovery. Key resistance is at 215, while support remains at 200. The MACD and RSI indicate potential for upward movement, but caution is warranted.
Confidence Level
Potential Risks
Market conditions, including interest rates and economic data, could significantly impact the stock's performance.