AAPL Trading Predictions
1 Day Prediction
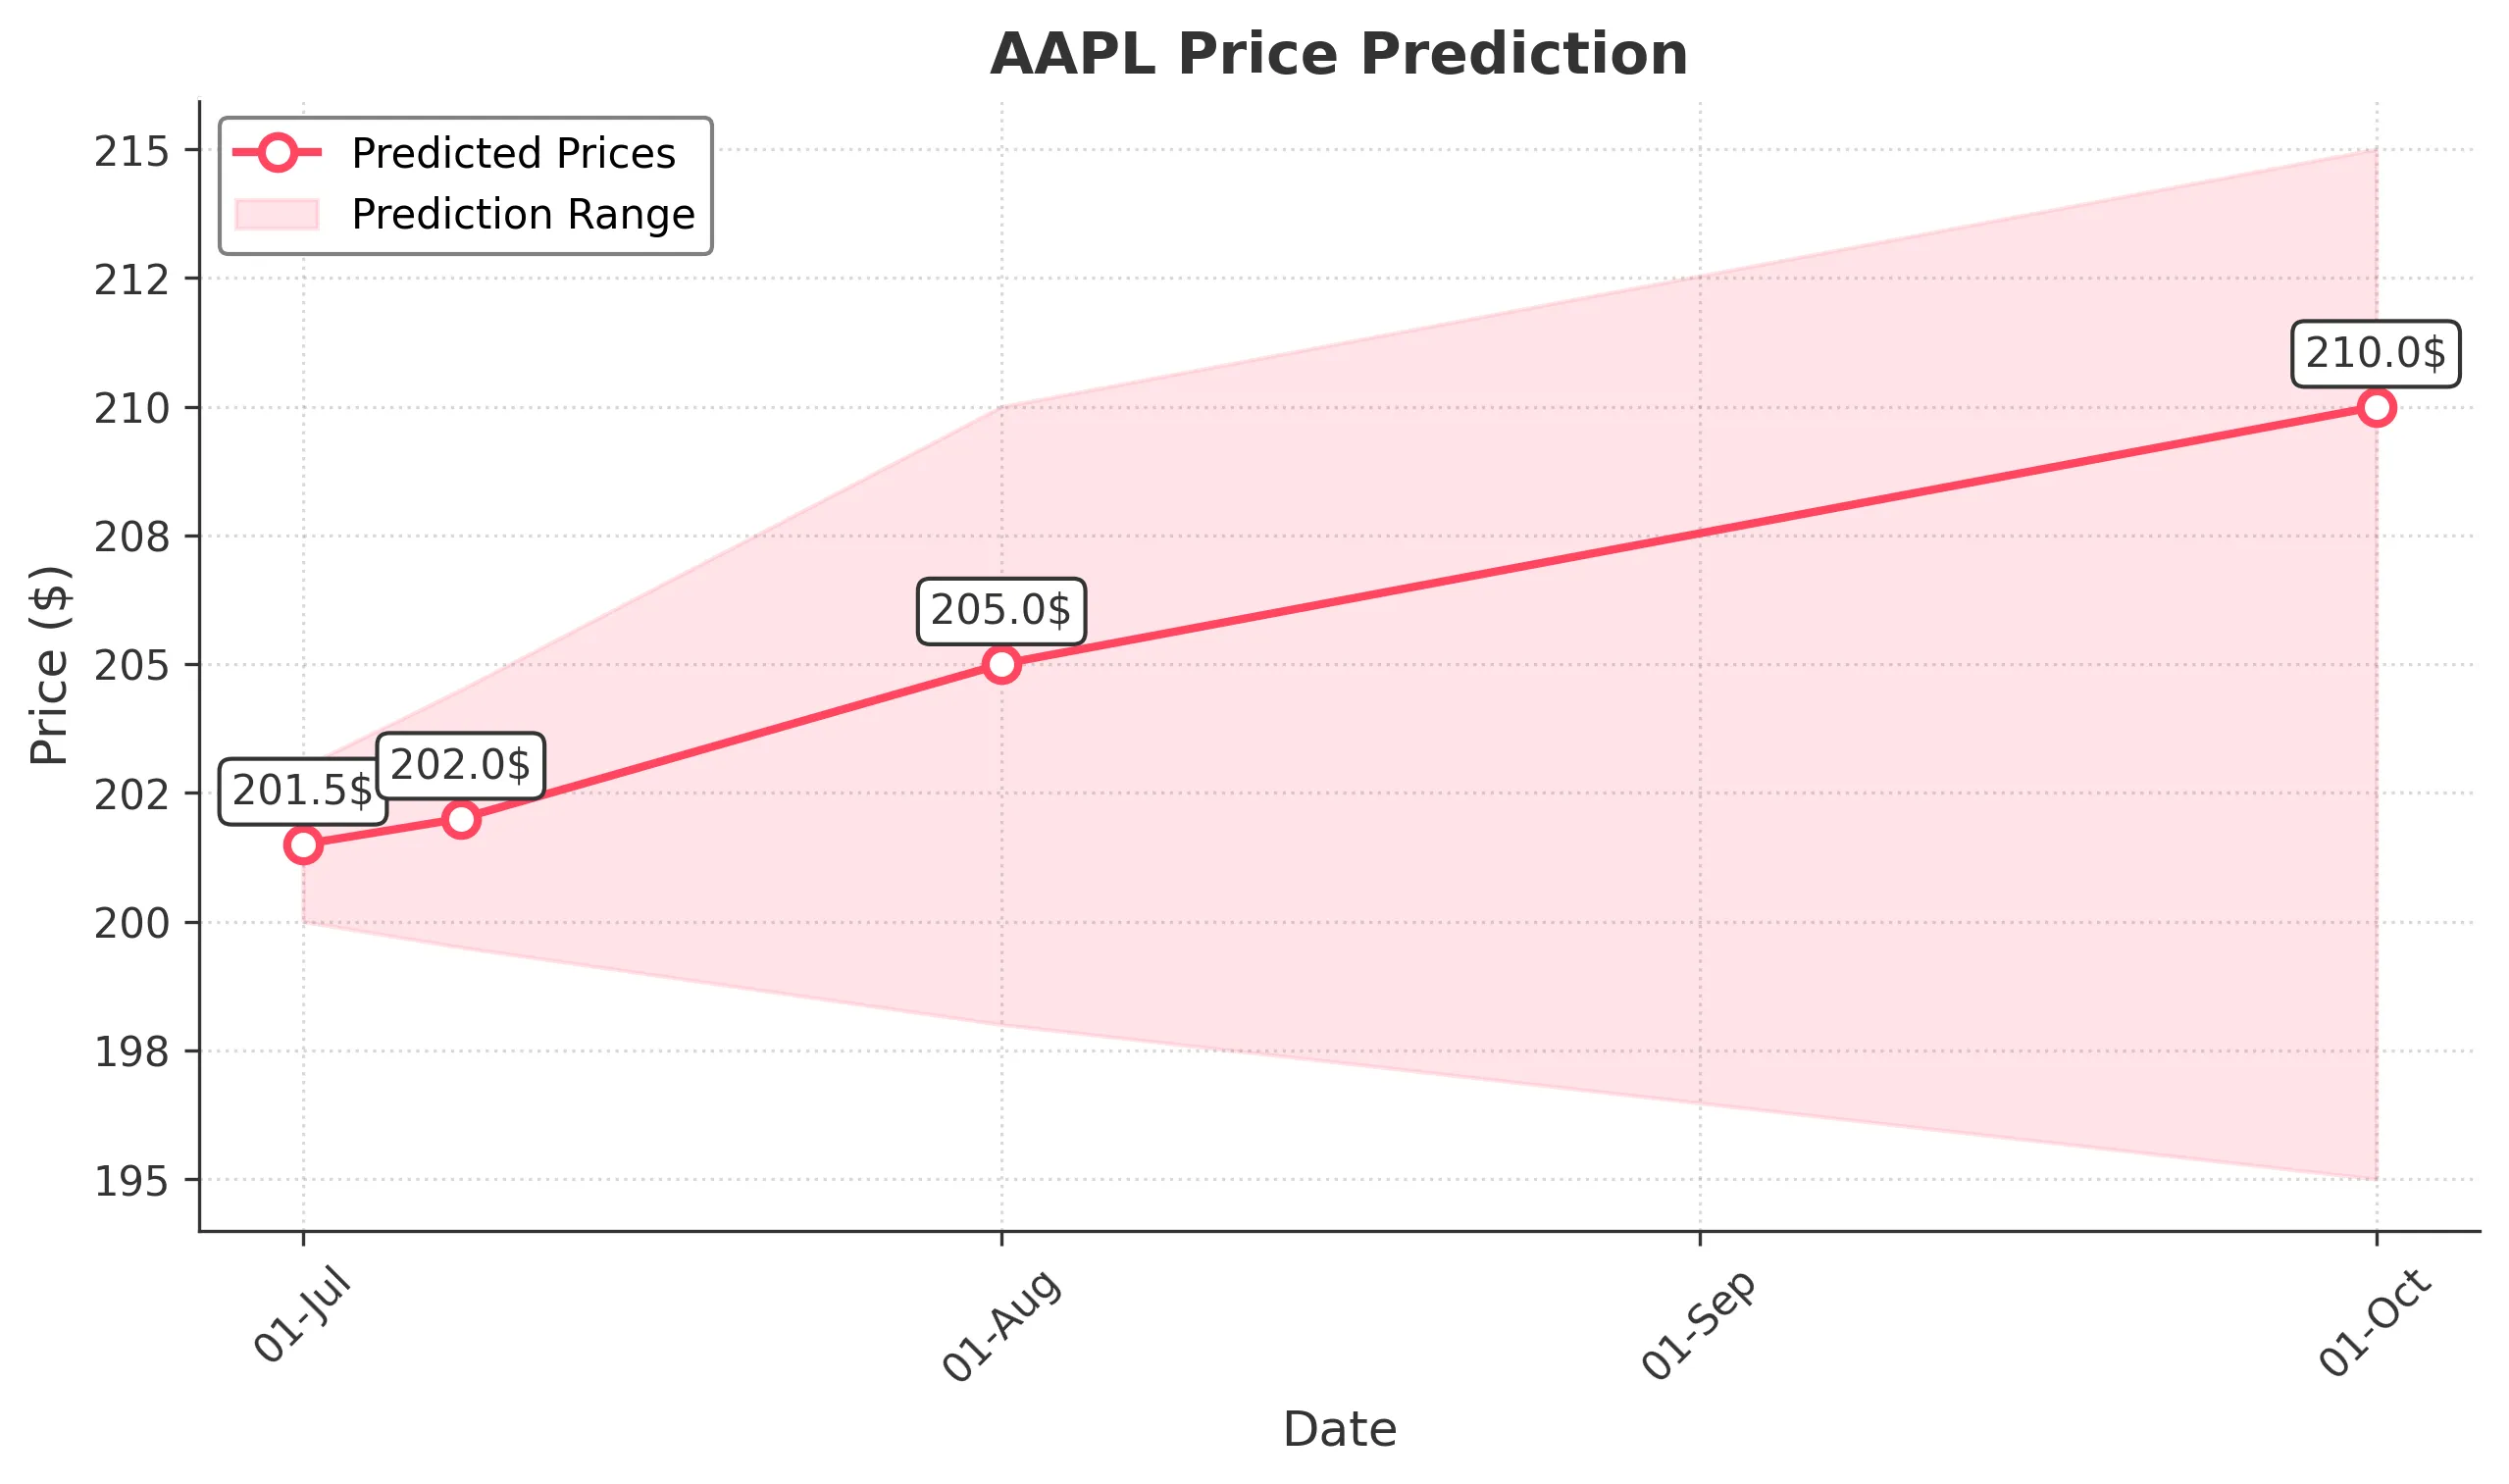
Target: July 1, 2025$201.5
$201
$203
$200
Description
AAPL shows a slight bullish trend with a recent Doji candlestick indicating indecision. The RSI is neutral, and MACD is close to crossing above the signal line, suggesting potential upward momentum. However, recent volatility may limit gains.
Analysis
Over the past 3 months, AAPL has experienced significant volatility, with a bearish trend recently. Key support is around $200, while resistance is near $203. The RSI indicates neutral momentum, and volume spikes suggest increased interest. Overall, the outlook is cautiously optimistic.
Confidence Level
Potential Risks
Market sentiment could shift due to macroeconomic news or earnings reports, which may impact the stock's performance.
1 Week Prediction
Target: July 8, 2025$202
$201.5
$204.5
$199.5
Description
The stock is expected to stabilize around $202 as it approaches a Fibonacci retracement level. The MACD shows potential bullish divergence, but the RSI indicates overbought conditions, suggesting a possible pullback.
Analysis
AAPL's performance has been mixed, with recent bearish pressure. The stock is currently testing support levels, and the volume indicates cautious trading. The overall trend remains uncertain, with both bullish and bearish signals present.
Confidence Level
Potential Risks
External factors such as economic data releases or geopolitical events could lead to unexpected volatility.
1 Month Prediction
Target: August 1, 2025$205
$202.5
$210
$198
Description
AAPL is likely to recover slightly as it approaches key resistance levels. The Bollinger Bands suggest a potential breakout, but the RSI indicates overbought conditions, which could lead to a pullback.
Analysis
The past three months have shown a bearish trend with significant price fluctuations. Key support is at $200, while resistance is at $210. The stock's volatility is high, and external factors could influence future performance.
Confidence Level
Potential Risks
Market sentiment is volatile, and earnings reports could significantly impact stock performance.
3 Months Prediction
Target: October 1, 2025$210
$205
$215
$195
Description
AAPL may trend upwards as it approaches the end of the quarter, supported by potential positive earnings. However, the RSI indicates potential overbought conditions, which could lead to corrections.
Analysis
AAPL's performance has been characterized by volatility and mixed signals. The stock is currently at a critical juncture, with support at $200 and resistance at $215. The overall trend remains uncertain, with both bullish and bearish indicators present.
Confidence Level
Potential Risks
Unforeseen macroeconomic events or changes in market sentiment could lead to significant price adjustments.