AAPL Trading Predictions
1 Day Prediction
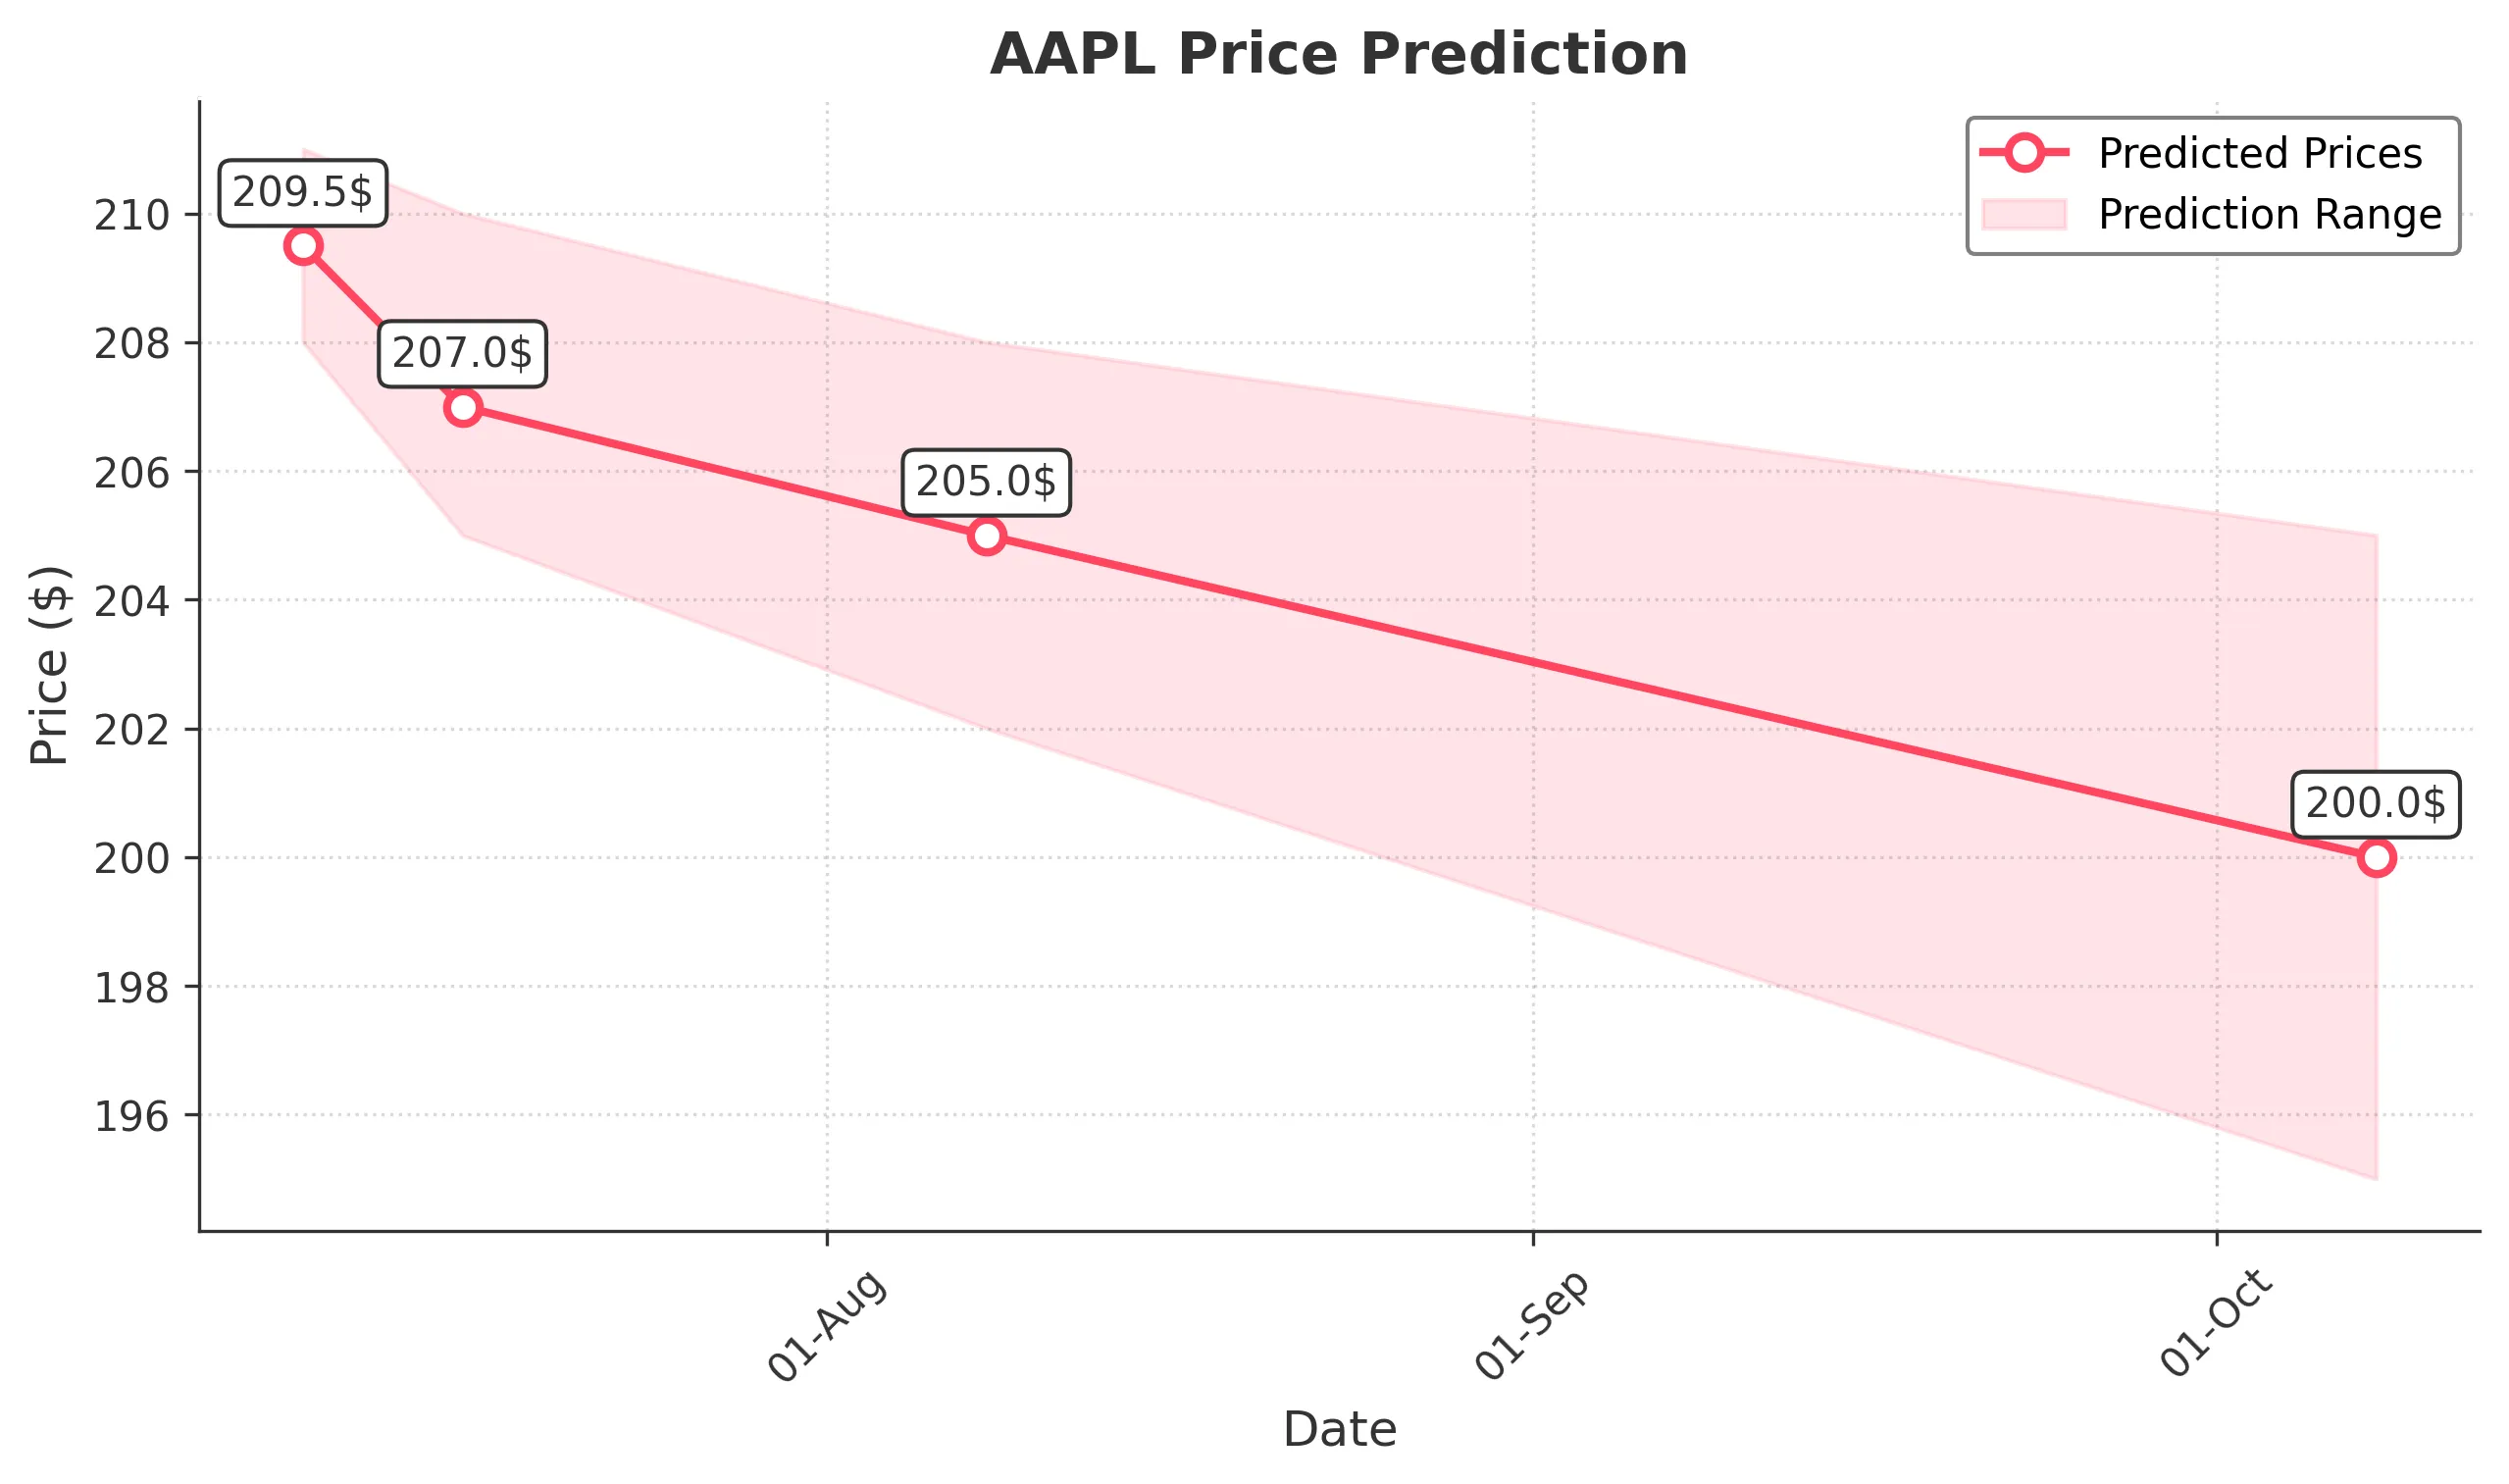
Target: July 9, 2025$209.5
$209
$211
$208
Description
AAPL shows a slight bearish trend with recent lower highs and lower lows. The RSI indicates oversold conditions, suggesting a potential bounce. However, the MACD is bearish, and volume has been declining, indicating caution.
Analysis
Over the past 3 months, AAPL has shown a mix of bullish and bearish trends, with significant resistance around $212. Recent candlestick patterns indicate indecision, and the ATR suggests increased volatility. Volume spikes on down days raise concerns about selling pressure.
Confidence Level
Potential Risks
Market volatility and external news could impact the price significantly.
1 Week Prediction
Target: July 16, 2025$207
$208.5
$210
$205
Description
The bearish trend may continue as AAPL struggles to maintain upward momentum. The MACD remains negative, and the RSI is approaching oversold levels, indicating potential for a short-term bounce but overall weakness.
Analysis
AAPL has faced resistance at $212, with recent price action showing a downward trend. The stock has been trading in a range, and the volume analysis indicates a lack of strong buying interest. The market sentiment is cautious, influenced by macroeconomic factors.
Confidence Level
Potential Risks
Unexpected market news or earnings reports could lead to volatility.
1 Month Prediction
Target: August 8, 2025$205
$206
$208
$202
Description
AAPL may continue to face downward pressure as the overall market sentiment remains bearish. The Fibonacci retracement levels suggest support around $205, but the lack of bullish signals raises concerns about further declines.
Analysis
The stock has been in a bearish phase, with significant resistance at $212. Technical indicators show weakness, and the volume patterns suggest selling pressure. The market's overall sentiment is cautious, influenced by broader economic conditions.
Confidence Level
Potential Risks
Potential for a reversal exists if market conditions improve or if positive news emerges.
3 Months Prediction
Target: October 8, 2025$200
$202
$205
$195
Description
If the bearish trend persists, AAPL could test lower support levels around $200. The MACD and RSI indicate continued weakness, and external economic factors may further impact performance.
Analysis
AAPL's performance over the last three months has been characterized by volatility and bearish sentiment. Key support levels are being tested, and the overall market environment is uncertain. Technical indicators suggest a potential for further declines.
Confidence Level
Potential Risks
Market conditions could change rapidly, affecting the stock's trajectory.