AAPL Trading Predictions
1 Day Prediction
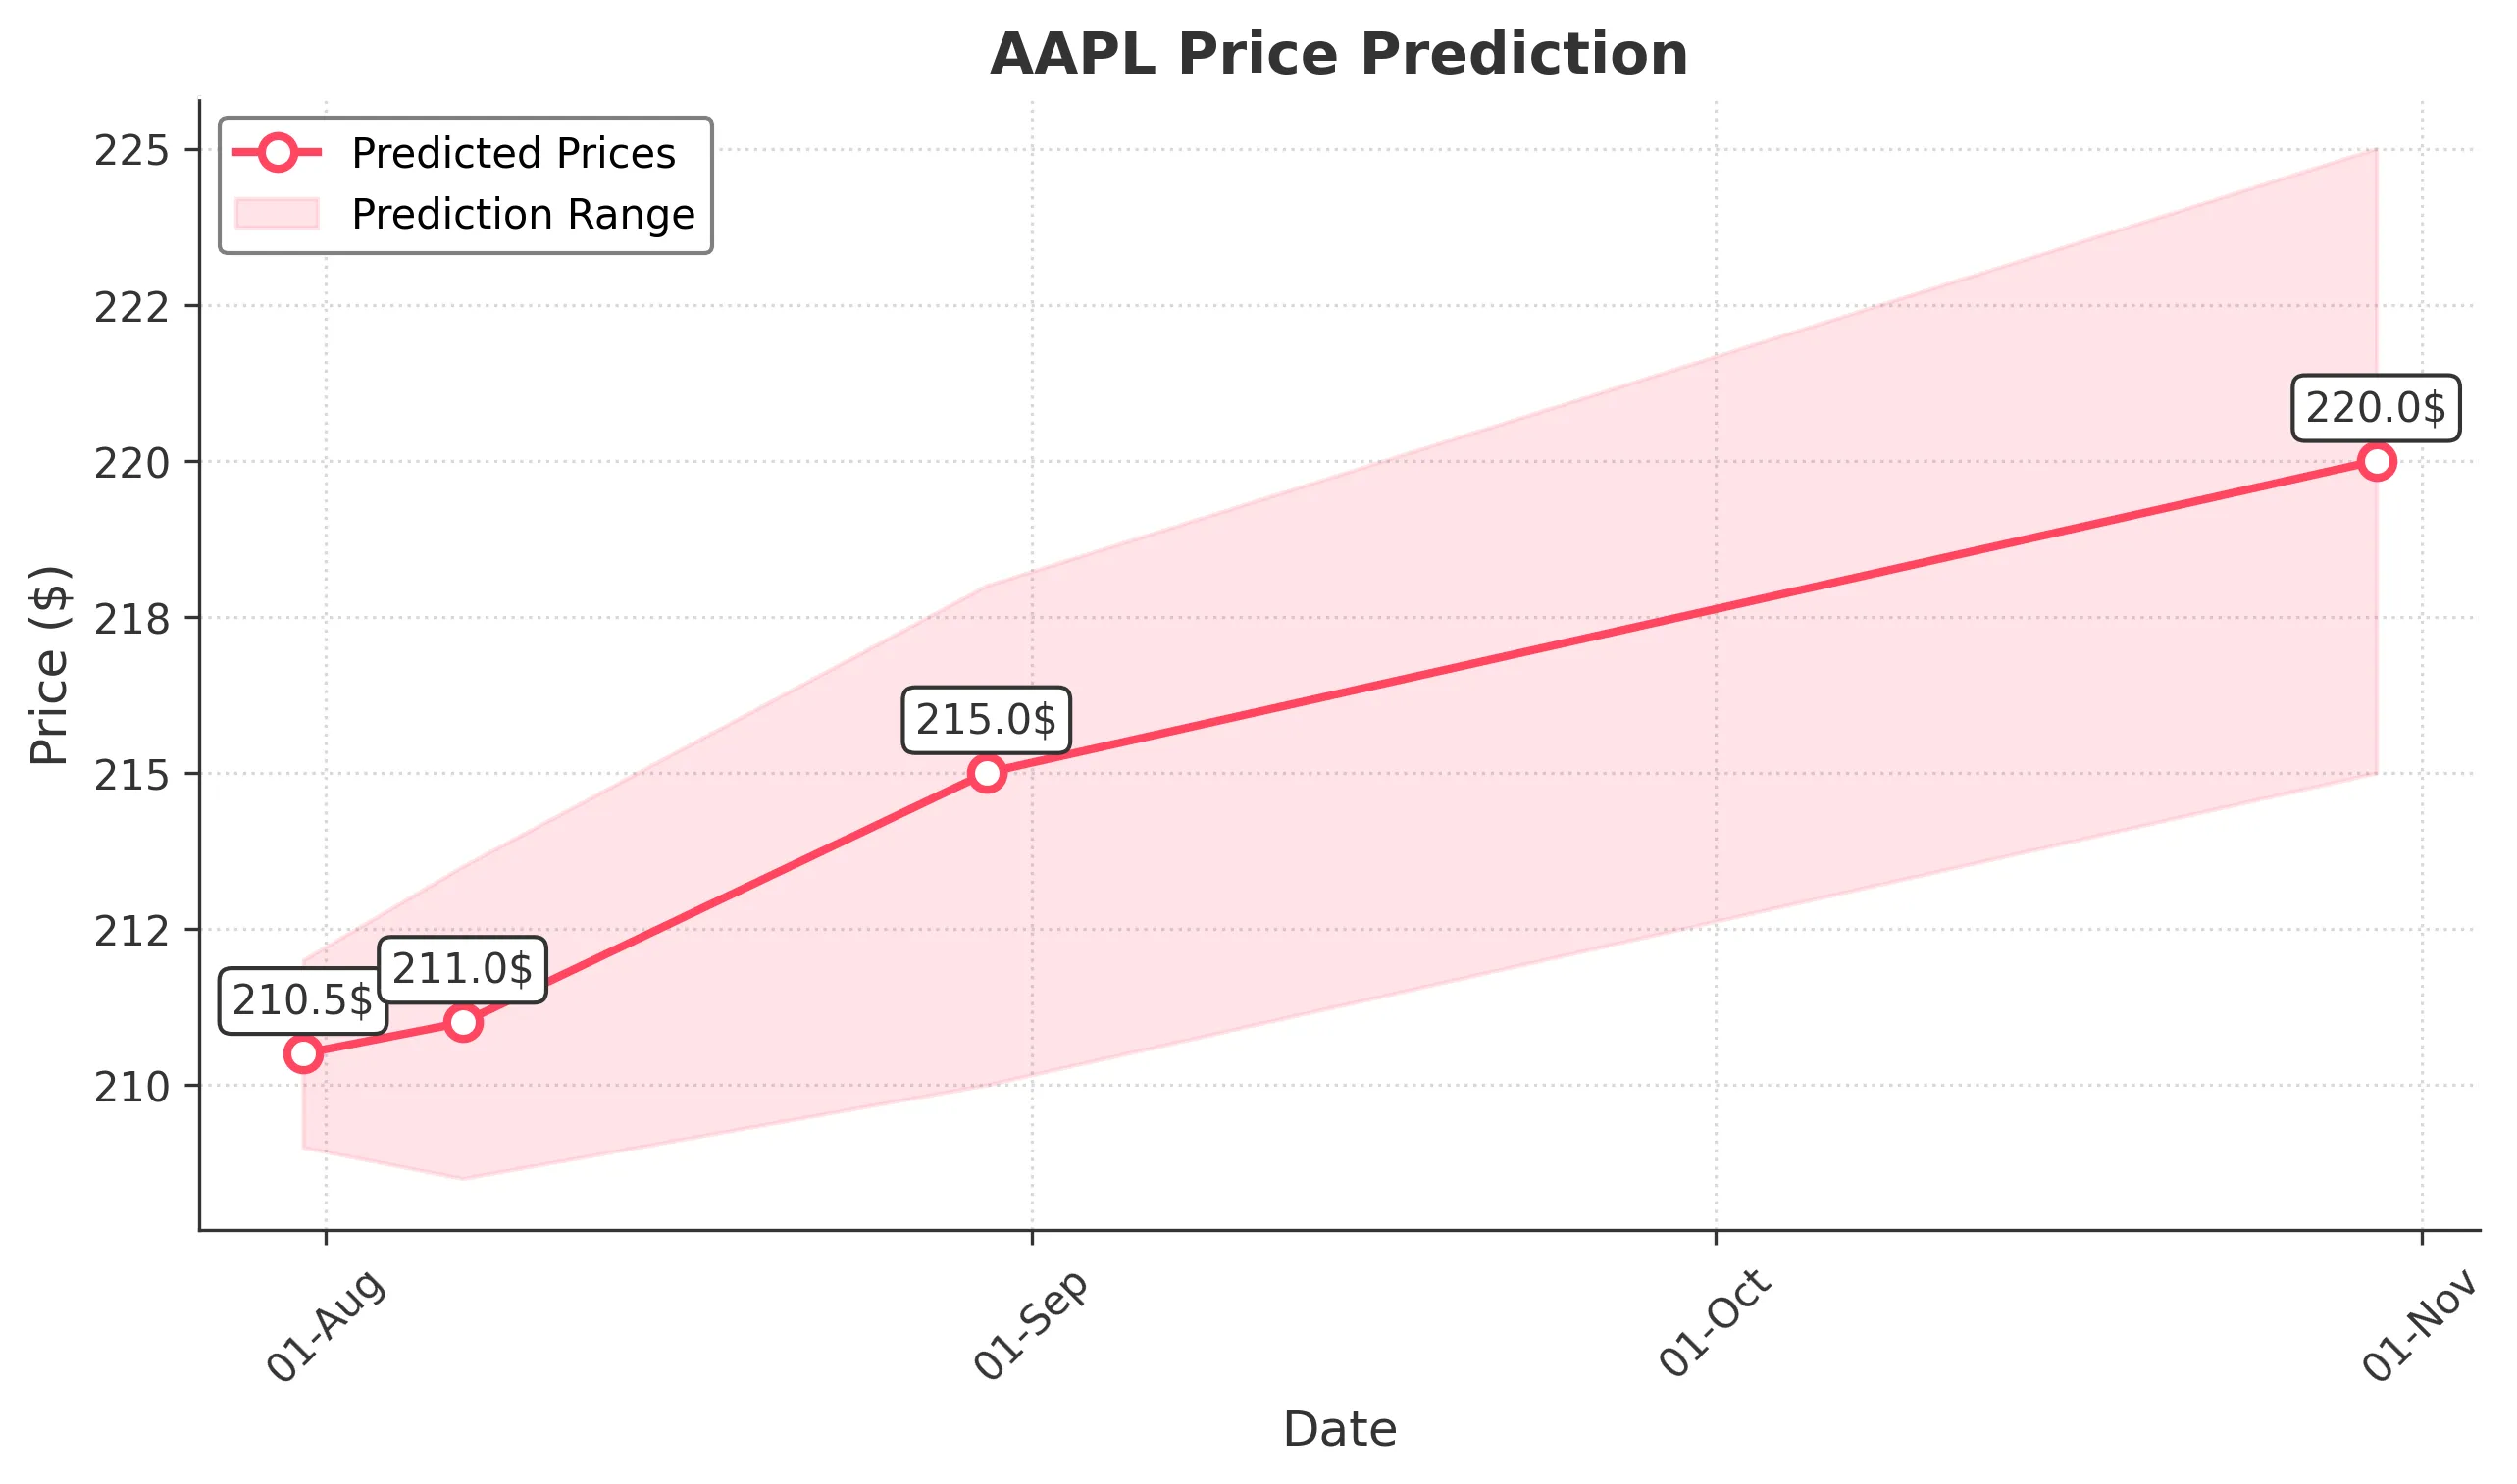
Target: July 31, 2025$210.5
$210.7
$212
$209
Description
AAPL shows a slight bearish trend with recent lower highs and lower lows. The RSI indicates oversold conditions, suggesting a potential bounce. However, the MACD is bearish, and volume has been declining, indicating caution.
Analysis
Over the past 3 months, AAPL has experienced a bearish trend with significant support around $210. The RSI is nearing oversold levels, while MACD shows bearish momentum. Volume spikes were noted during sell-offs, indicating potential weakness.
Confidence Level
Potential Risks
Market volatility and external news could impact the price significantly.
1 Week Prediction
Target: August 7, 2025$211
$210.5
$213.5
$208.5
Description
AAPL may stabilize around $211 as it approaches key support levels. The Bollinger Bands suggest a potential squeeze, indicating a breakout could occur. However, bearish sentiment persists, and caution is advised.
Analysis
The stock has been in a bearish phase, with resistance at $215. Recent candlestick patterns show indecision. Volume analysis indicates a lack of strong buying interest, and macroeconomic factors may weigh on performance.
Confidence Level
Potential Risks
Potential for further declines if market sentiment worsens or if earnings reports are disappointing.
1 Month Prediction
Target: August 30, 2025$215
$211.5
$218
$210
Description
AAPL could recover to $215 as it tests resistance levels. The RSI may improve, indicating a potential reversal. However, macroeconomic factors and earnings reports will be crucial in determining the trend.
Analysis
The stock has shown signs of recovery but remains under pressure. Key resistance at $215 and support at $210 are critical. The MACD is showing signs of convergence, suggesting a potential bullish reversal if conditions improve.
Confidence Level
Potential Risks
Uncertainty in market conditions and potential earnings misses could lead to volatility.
3 Months Prediction
Target: October 30, 2025$220
$218
$225
$215
Description
If AAPL can break through resistance levels, it may reach $220. Positive earnings and market sentiment could drive this. However, external economic factors remain a risk.
Analysis
AAPL's performance over the last 3 months has been mixed, with bearish trends dominating. Key support at $210 and resistance at $215 are pivotal. The market's overall sentiment and macroeconomic conditions will heavily influence future performance.
Confidence Level
Potential Risks
Economic downturns or negative news could reverse the trend, impacting the stock's performance.