AAPL Trading Predictions
1 Day Prediction
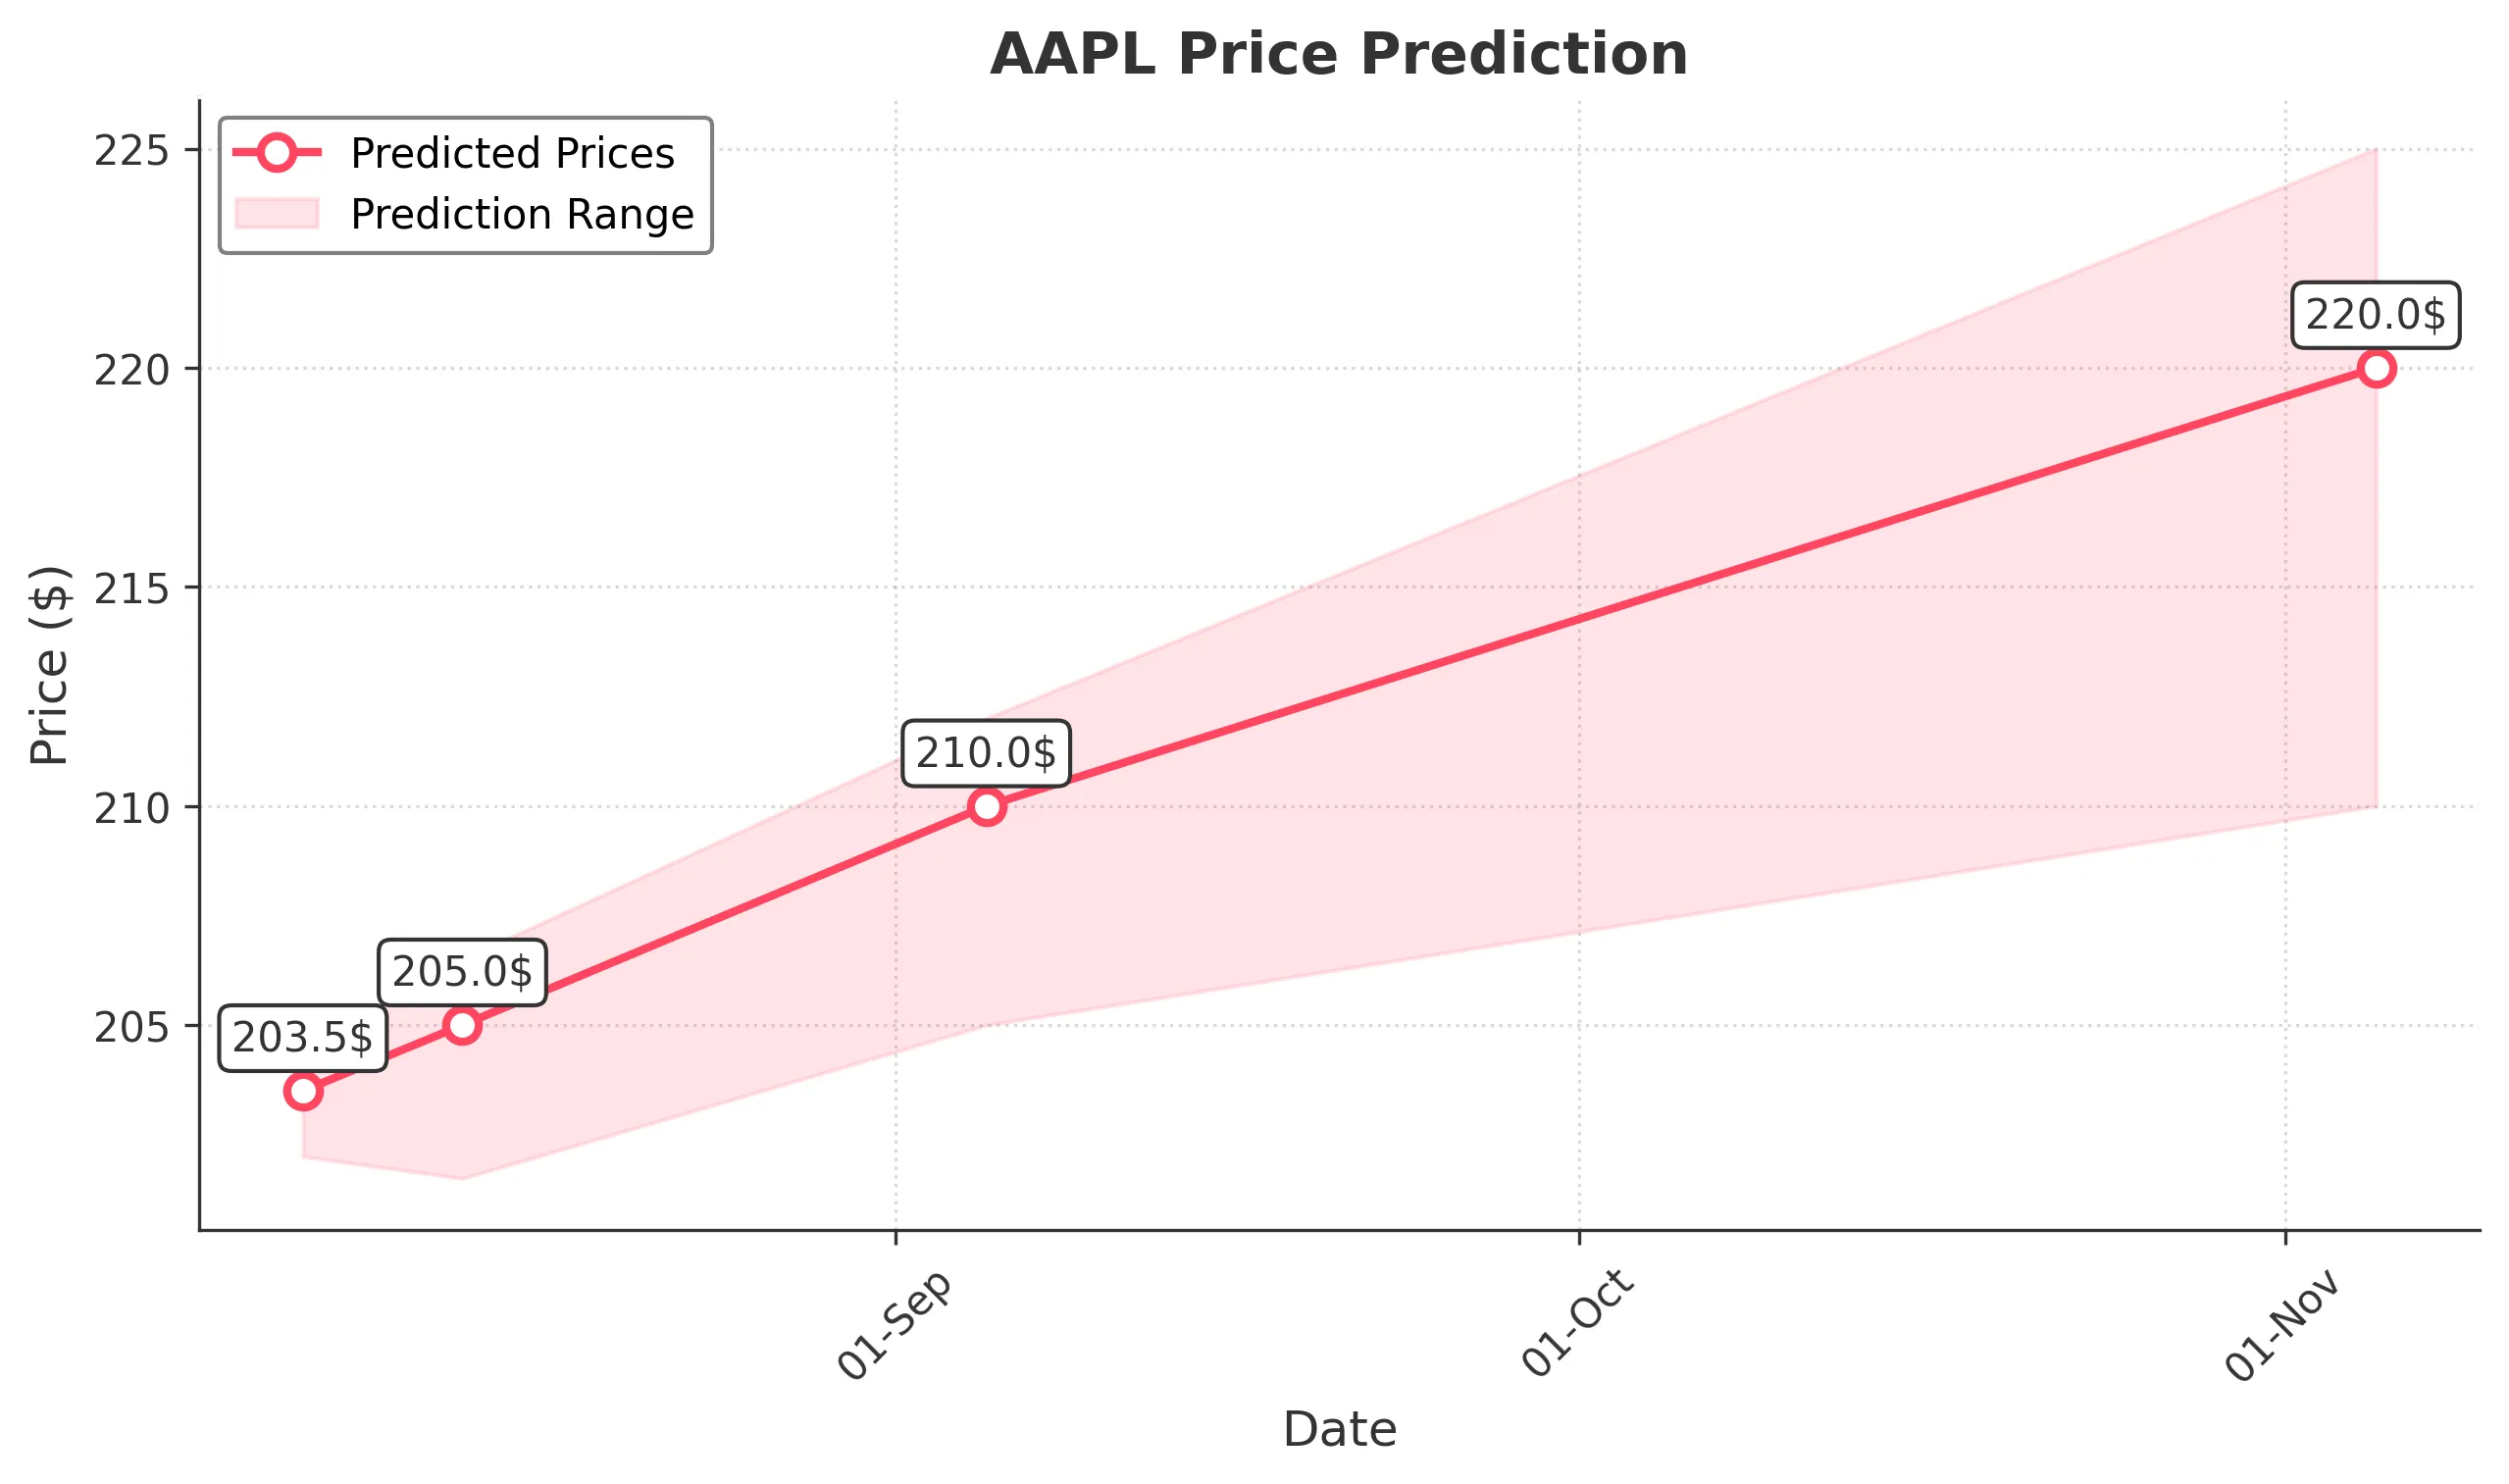
Target: August 6, 2025$203.5
$202.8
$204.5
$202
Description
AAPL shows a slight bullish trend with a recent Doji candlestick indicating indecision. The RSI is near 50, suggesting a neutral momentum. Expect a close around 203.50 as the market stabilizes after recent volatility.
Analysis
Over the past 3 months, AAPL has experienced volatility with a recent bearish trend. Key support at 200.00 and resistance at 215.00. The MACD shows a bearish crossover, while ATR indicates increased volatility. Volume spikes on down days suggest selling pressure.
Confidence Level
Potential Risks
Market sentiment could shift due to external news or earnings reports, impacting the prediction.
1 Week Prediction
Target: August 13, 2025$205
$203.5
$206.5
$201.5
Description
Expect a slight recovery as AAPL approaches key Fibonacci retracement levels. The MACD may show signs of bullish divergence, indicating potential upward momentum. Volume is expected to increase as traders react to market sentiment.
Analysis
AAPL has been in a bearish phase recently, with significant resistance at 210.00. The RSI is recovering from oversold conditions, suggesting a possible bounce. Volume analysis indicates a mixed sentiment, with higher volumes on down days.
Confidence Level
Potential Risks
Potential for further bearish sentiment if macroeconomic factors worsen or if earnings disappoint.
1 Month Prediction
Target: September 5, 2025$210
$206.5
$212
$205
Description
AAPL may recover towards 210.00 as it approaches a critical resistance level. The Bollinger Bands suggest a potential breakout, while the RSI indicates a bullish trend. Increased volume could support this upward movement.
Analysis
The stock has shown a bearish trend recently, but signs of recovery are emerging. Key support at 200.00 and resistance at 215.00. The MACD is showing potential bullish signals, while ATR indicates moderate volatility.
Confidence Level
Potential Risks
Economic data releases or geopolitical events could impact market sentiment and lead to volatility.
3 Months Prediction
Target: November 5, 2025$220
$215
$225
$210
Description
AAPL is expected to trend upwards towards 220.00 as it breaks through resistance levels. Positive earnings reports and market sentiment could drive this increase. The MACD and RSI indicate bullish momentum.
Analysis
AAPL has shown volatility with a recent bearish trend, but potential for recovery exists. Key resistance at 215.00 and support at 200.00. The MACD is turning bullish, and volume patterns suggest accumulation, indicating a possible upward trend.
Confidence Level
Potential Risks
Market corrections or negative news could reverse the trend, impacting the prediction.