AAPL Trading Predictions
1 Day Prediction
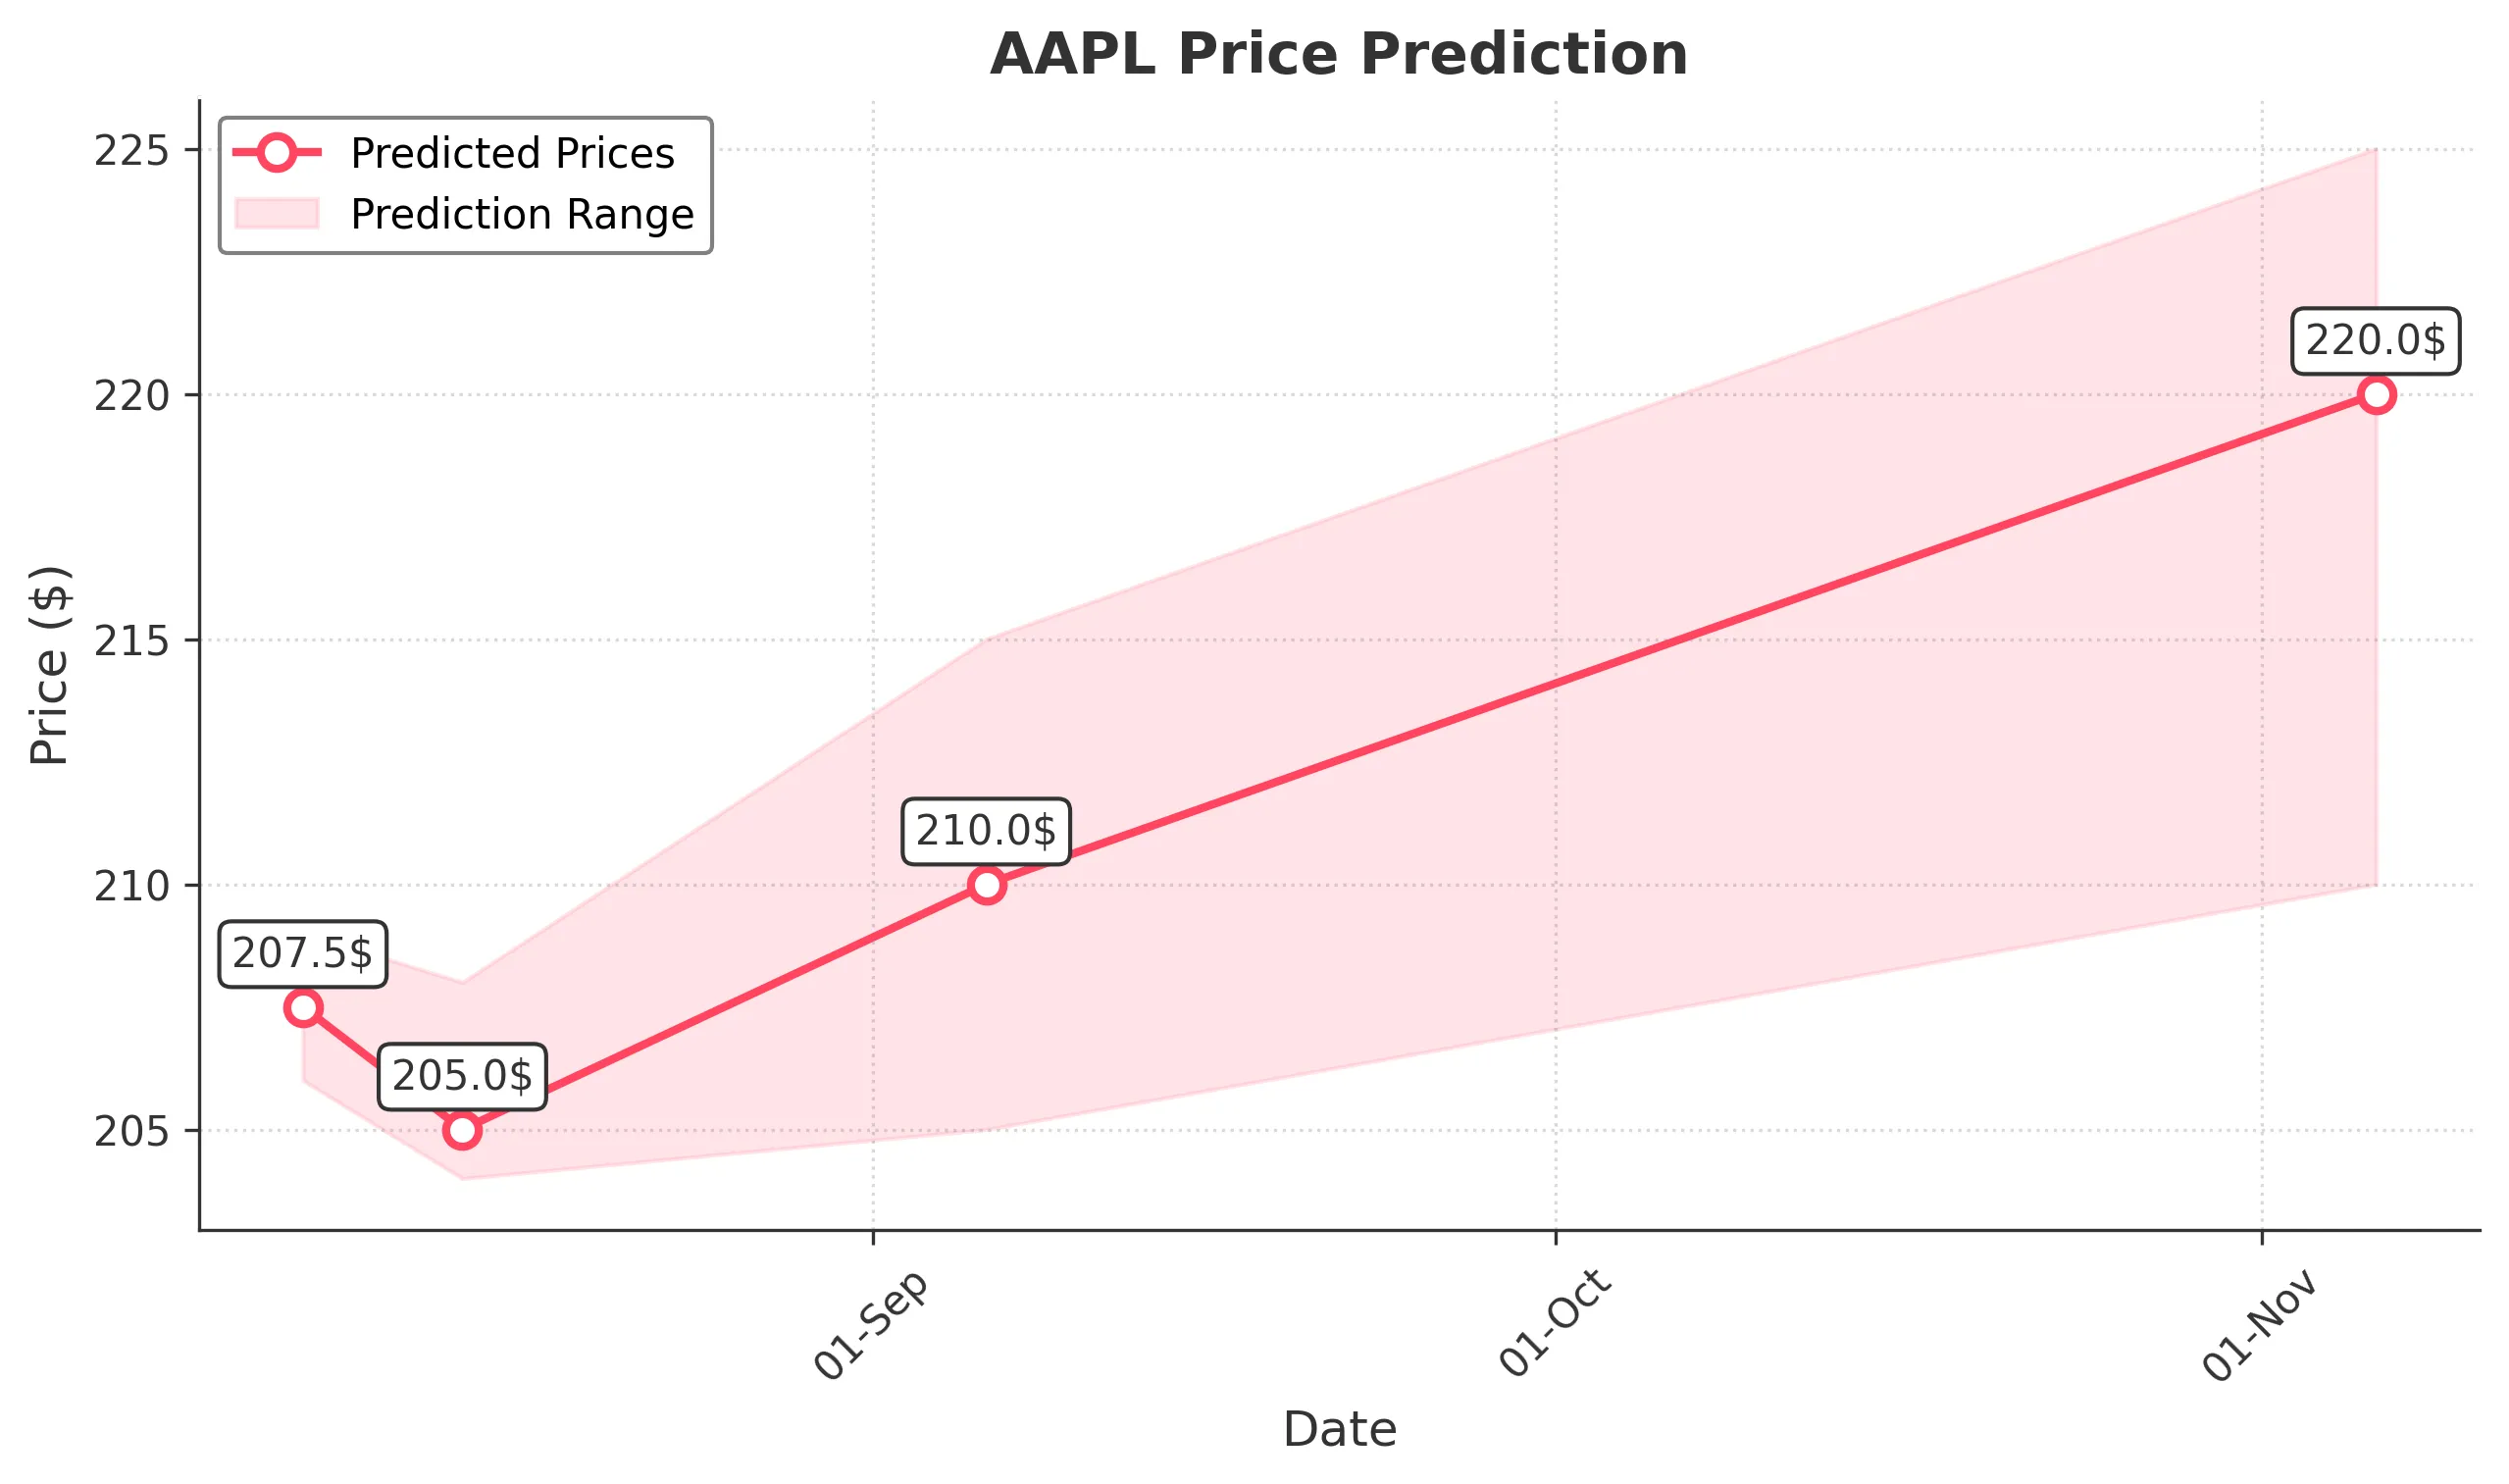
Target: August 7, 2025$207.5
$207
$209
$206
Description
AAPL shows a slight bullish trend with a recent Doji candlestick indicating indecision. The RSI is near 50, suggesting a potential upward move. However, the MACD is flattening, indicating possible resistance. Volume spikes on recent days suggest increased interest.
Analysis
Over the past 3 months, AAPL has shown a bearish trend with significant fluctuations. Key support is around $200, while resistance is near $215. The RSI indicates neutral momentum, and the MACD shows potential for a reversal. Volume patterns suggest increased trading activity, but recent declines raise concerns.
Confidence Level
Potential Risks
Market volatility and external news could impact the price. A bearish reversal is possible if the price fails to hold above key support levels.
1 Week Prediction
Target: August 14, 2025$205
$206.5
$208
$204
Description
The bearish trend may continue as AAPL faces resistance at $210. The MACD indicates a potential downward momentum, while the RSI is approaching oversold territory. Volume remains high, suggesting traders are cautious.
Analysis
AAPL has experienced significant price swings, with a recent bearish trend. Key support at $200 is critical, while resistance at $210 remains a challenge. The ATR indicates increased volatility, and the overall market sentiment is cautious.
Confidence Level
Potential Risks
Unforeseen macroeconomic events or earnings reports could lead to volatility. A break below $200 could trigger further selling pressure.
1 Month Prediction
Target: September 6, 2025$210
$208
$215
$205
Description
AAPL may recover slightly as it approaches key Fibonacci retracement levels. The RSI could rebound from oversold conditions, and the MACD may show signs of bullish divergence. However, resistance at $215 remains a concern.
Analysis
The stock has shown volatility with a bearish trend recently. Key support at $200 and resistance at $215 are critical levels. The MACD and RSI suggest potential for a rebound, but caution is warranted due to overall market conditions.
Confidence Level
Potential Risks
Market sentiment could shift due to economic data releases or geopolitical events. A failure to break above $215 could lead to renewed selling pressure.
3 Months Prediction
Target: November 6, 2025$220
$215
$225
$210
Description
If AAPL can break through resistance at $215, it may rally towards $220. The MACD could turn bullish, and the RSI may stabilize. However, external factors like earnings and market sentiment will play a crucial role.
Analysis
AAPL's performance has been mixed, with significant volatility. The stock is currently testing key support and resistance levels. The overall trend remains uncertain, with potential for both upward and downward movements depending on market conditions.
Confidence Level
Potential Risks
Potential economic downturns or negative news could impact the stock's performance. A failure to maintain momentum could lead to a reversal.