AMZN Trading Predictions
1 Day Prediction
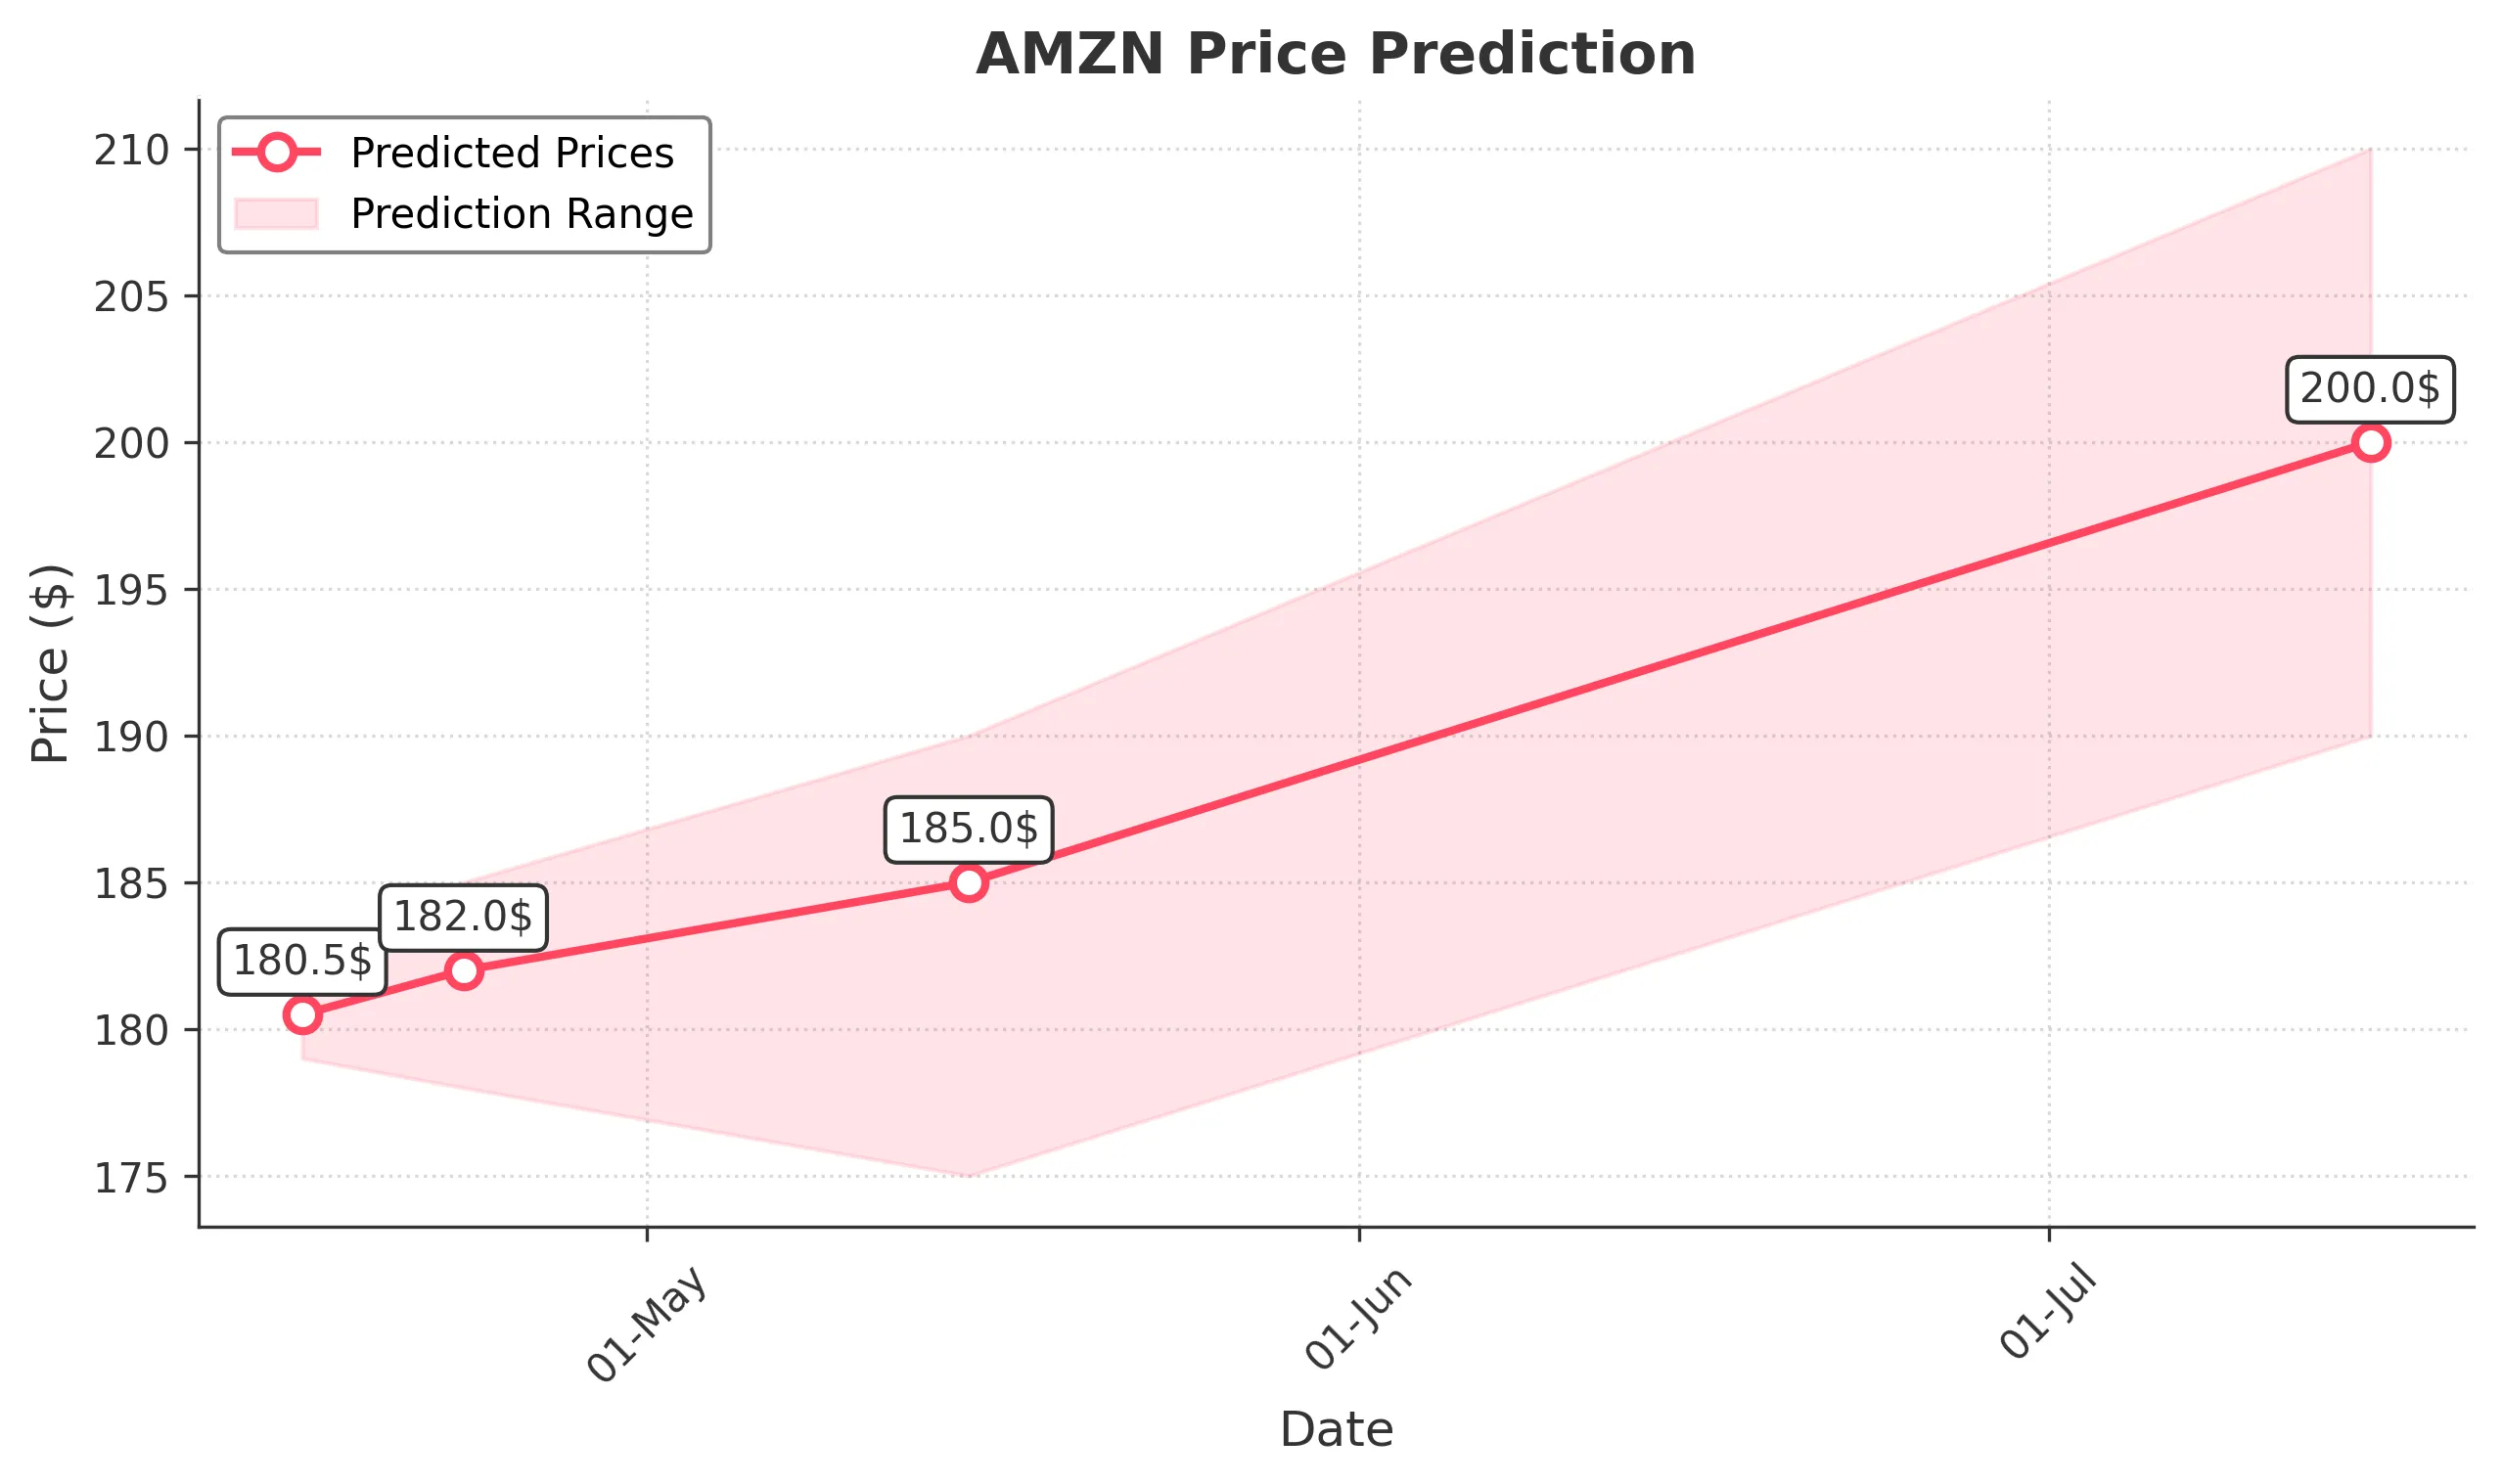
Target: April 16, 2025$180.5
$181
$182
$179
Description
The stock shows a bearish trend with recent lower highs and lower lows. RSI indicates oversold conditions, but MACD is bearish. Expect a slight recovery, but overall sentiment remains cautious due to recent volatility.
Analysis
AMZN has experienced significant volatility, with a recent downtrend. Key support at 180.00 and resistance at 185.00. Volume spikes indicate selling pressure. Technical indicators suggest a potential short-term bounce, but overall bearish sentiment prevails.
Confidence Level
Potential Risks
Market sentiment could shift rapidly due to macroeconomic news or earnings reports, impacting the prediction.
1 Week Prediction
Target: April 23, 2025$182
$180.5
$185
$178
Description
Expect a slight recovery as the stock approaches key support levels. However, bearish momentum persists. Watch for potential reversal patterns in candlesticks and volume trends.
Analysis
The stock has been in a bearish phase, with significant selling pressure. Key support at 180.00 and resistance at 185.00. Technical indicators show mixed signals, with potential for a short-term bounce but overall bearish sentiment remains.
Confidence Level
Potential Risks
Uncertainty in market conditions and potential earnings reports could lead to unexpected price movements.
1 Month Prediction
Target: May 15, 2025$185
$182
$190
$175
Description
A potential recovery is anticipated as the stock approaches oversold conditions. However, macroeconomic factors and earnings reports could influence volatility.
Analysis
AMZN has shown bearish trends with significant volatility. Key support at 180.00 and resistance at 190.00. Technical indicators suggest a potential recovery, but external factors could impact performance.
Confidence Level
Potential Risks
Market sentiment is fragile, and any negative news could reverse the expected recovery.
3 Months Prediction
Target: July 15, 2025$200
$195
$210
$190
Description
Long-term recovery is possible if the stock can break above resistance levels. Watch for bullish patterns and improving market sentiment.
Analysis
The stock has been in a bearish trend but shows potential for recovery. Key resistance at 210.00 and support at 190.00. Technical indicators suggest a possible reversal, but external factors could impact the trajectory.
Confidence Level
Potential Risks
Long-term predictions are subject to macroeconomic changes and market sentiment shifts.