AMZN Trading Predictions
1 Day Prediction
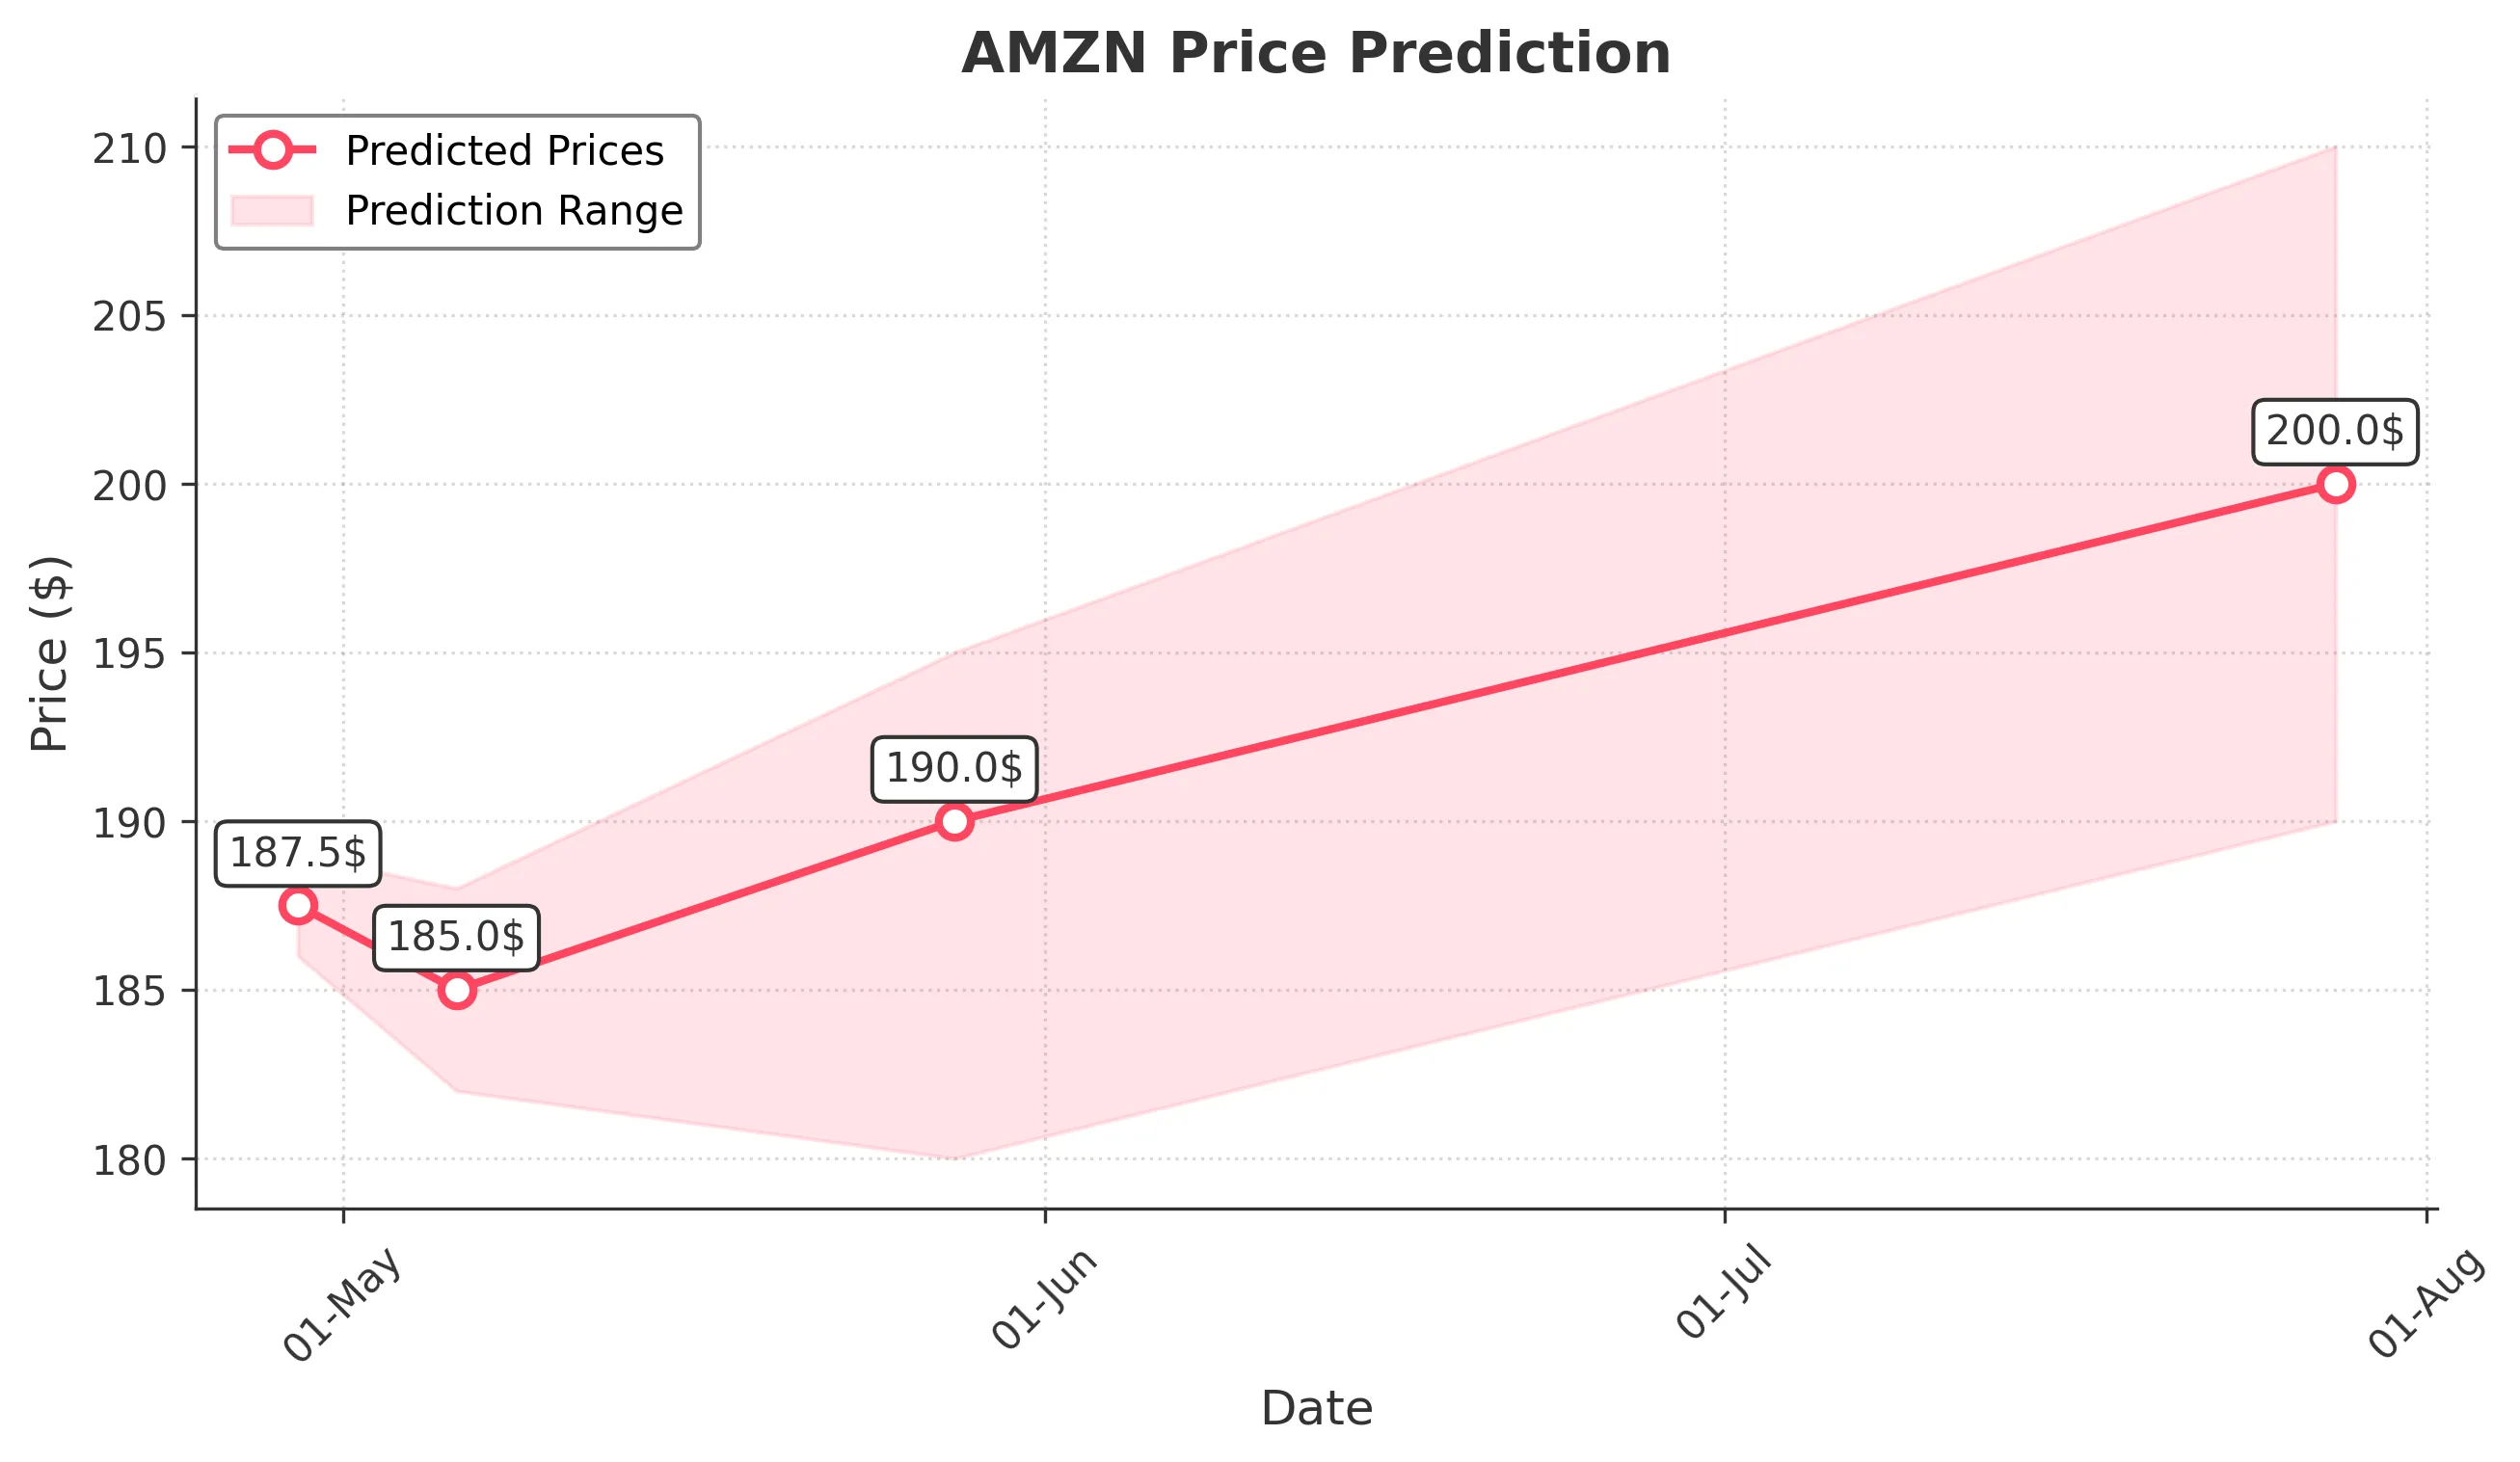
Target: April 29, 2025$187.5
$188
$189
$186
Description
The stock shows a slight bearish trend with recent lower highs and lower lows. The RSI indicates oversold conditions, suggesting a potential bounce. However, the MACD is bearish, and volume has been declining, indicating caution.
Analysis
AMZN has been in a bearish trend over the past three months, with significant support around $180. The recent price action shows a series of lower highs, and the MACD is below the signal line. Volume spikes on down days indicate selling pressure. The RSI is approaching oversold levels, suggesting a potential short-term bounce.
Confidence Level
Potential Risks
Market volatility and external news could impact the prediction. A sudden market shift could lead to unexpected price movements.
1 Week Prediction
Target: May 6, 2025$185
$186
$188
$182
Description
The bearish trend is expected to continue, with resistance at $190. The MACD remains negative, and the RSI is still low. A potential bounce could occur, but overall sentiment remains weak.
Analysis
The stock has been under pressure, with key support at $180. The recent price action shows a lack of buying interest, and the MACD indicates continued bearish momentum. Volume analysis shows increased selling, and the overall market sentiment is cautious.
Confidence Level
Potential Risks
Unforeseen macroeconomic events or earnings reports could lead to volatility. The market sentiment is fragile, and any negative news could exacerbate the downtrend.
1 Month Prediction
Target: May 28, 2025$190
$185
$195
$180
Description
A potential recovery is anticipated as the stock approaches key support levels. The RSI may start to recover, indicating a possible reversal. However, the overall trend remains bearish.
Analysis
AMZN has been in a downtrend, but a potential reversal could occur if it holds above $180. The MACD is still bearish, but a divergence may form if the price stabilizes. Volume patterns suggest accumulation at lower levels, but overall market sentiment remains cautious.
Confidence Level
Potential Risks
The bearish trend could persist if market conditions do not improve. Economic indicators and earnings reports will be crucial in determining the stock's direction.
3 Months Prediction
Target: July 28, 2025$200
$195
$210
$190
Description
If the stock can stabilize and break above resistance levels, a gradual recovery could occur. The RSI may improve, and bullish sentiment could return if macroeconomic conditions stabilize.
Analysis
The stock has faced significant selling pressure, but if it can hold above $190, there may be a chance for recovery. The MACD is still bearish, but a potential bullish divergence could form. Volume analysis indicates a lack of strong buying interest, and external factors will play a significant role in future performance.
Confidence Level
Potential Risks
Long-term predictions are uncertain due to potential market volatility and economic factors. A bearish trend could continue if negative news arises.