AMZN Trading Predictions
1 Day Prediction
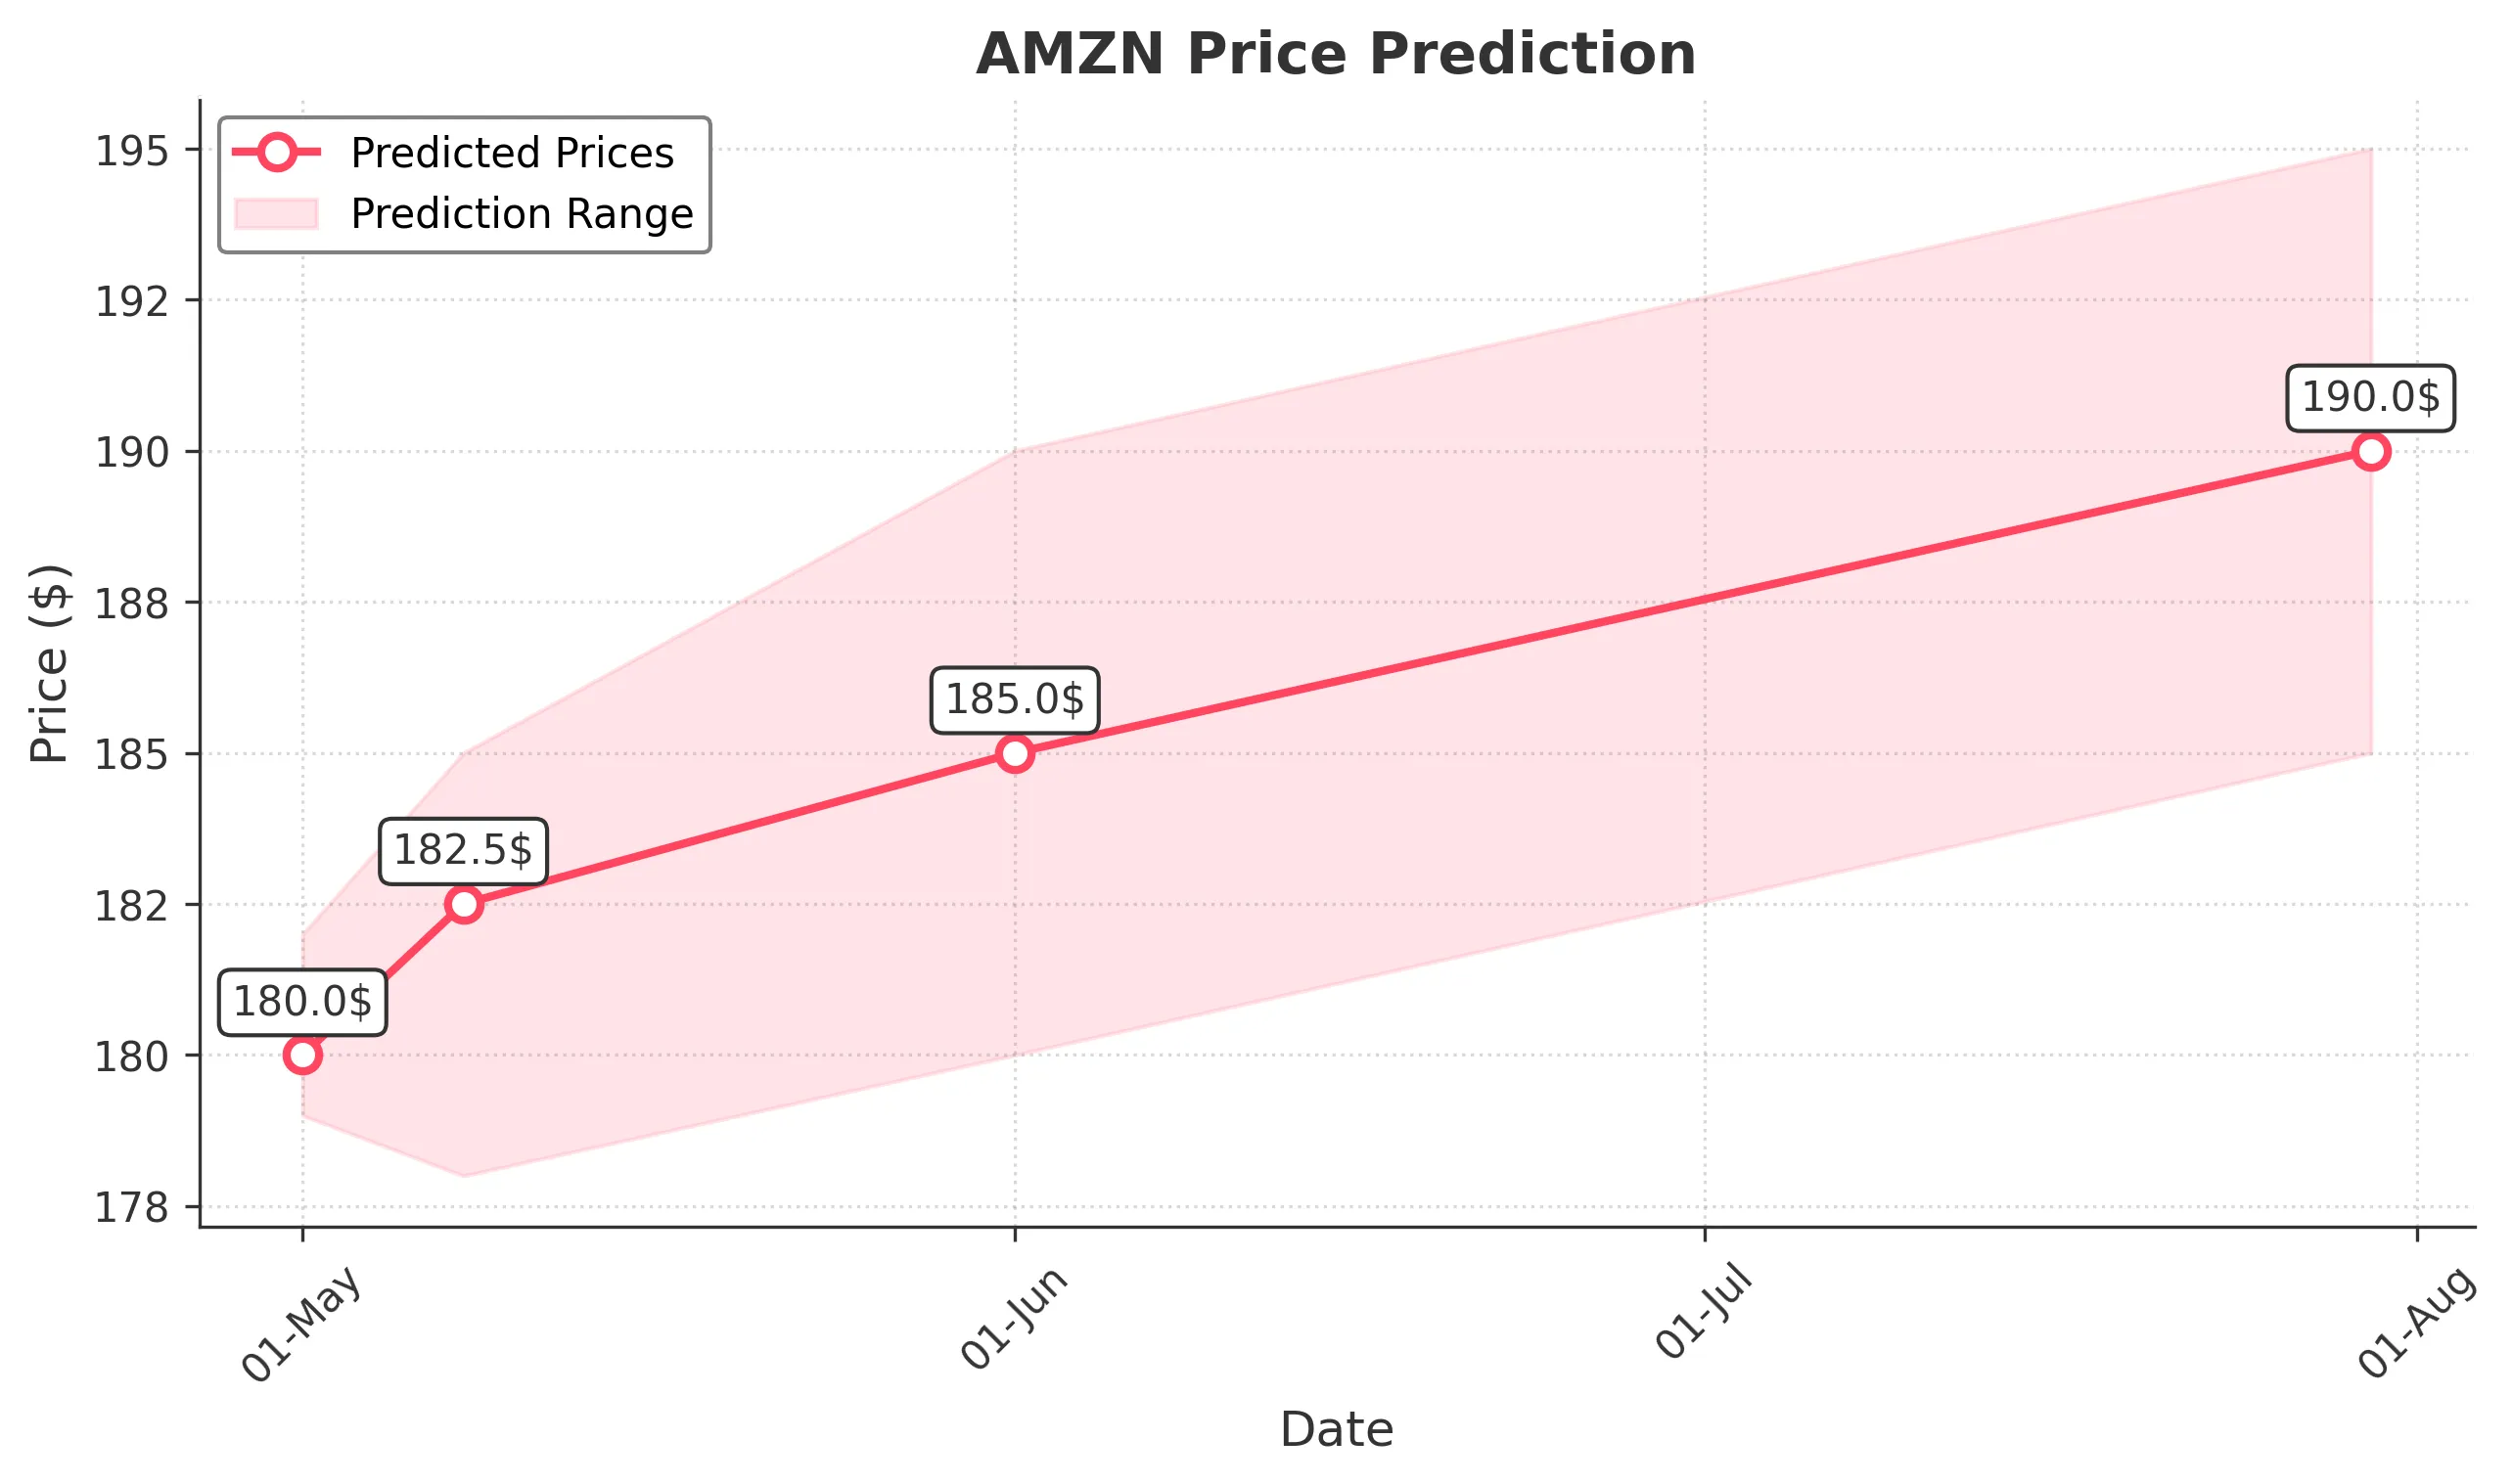
Target: May 1, 2025$180
$181
$182
$179
Description
The stock shows bearish momentum with a recent downtrend. The RSI indicates oversold conditions, but a potential bounce could occur. Volume spikes suggest increased selling pressure. Expect a slight recovery but overall bearish sentiment.
Analysis
AMZN has been in a bearish trend over the past three months, with significant support around $180. Recent volume spikes indicate selling pressure, while the RSI suggests oversold conditions. The MACD is bearish, and candlestick patterns show indecision.
Confidence Level
Potential Risks
Market volatility and external news could impact the prediction. A reversal pattern could emerge if bullish sentiment returns.
1 Week Prediction
Target: May 8, 2025$182.5
$180
$185
$178
Description
A potential short-term recovery is expected as the stock approaches key support levels. The RSI may recover from oversold territory, but bearish sentiment remains. Watch for volume trends to confirm any upward movement.
Analysis
The stock has shown a bearish trend with significant resistance at $185. Recent trading volumes indicate increased selling. The MACD remains negative, and the ATR suggests heightened volatility. A cautious approach is advised.
Confidence Level
Potential Risks
Unforeseen macroeconomic events or earnings reports could lead to volatility. The bearish trend may continue if selling pressure persists.
1 Month Prediction
Target: June 1, 2025$185
$182
$190
$180
Description
Expect a gradual recovery as the stock tests resistance levels. The RSI may stabilize, indicating a potential reversal. However, bearish sentiment could limit upside potential. Monitor for volume confirmation.
Analysis
AMZN's performance has been bearish, with key support at $180. The stock is currently testing resistance levels. The MACD is still negative, and the RSI indicates potential for recovery, but caution is warranted due to overall market sentiment.
Confidence Level
Potential Risks
Market sentiment and external factors could hinder recovery. A failure to break resistance may lead to further declines.
3 Months Prediction
Target: July 30, 2025$190
$188
$195
$185
Description
A potential recovery trend may develop if the stock can hold above key support levels. The RSI could indicate a bullish divergence if momentum builds. However, external factors may still pose risks.
Analysis
The stock has been in a bearish trend, with significant resistance at $195. Volume patterns suggest selling pressure, while the MACD remains negative. The ATR indicates potential volatility, and external economic factors could influence future performance.
Confidence Level
Potential Risks
Long-term predictions are uncertain due to potential market shifts and economic conditions. A bearish trend could resume if selling pressure continues.