AMZN Trading Predictions
1 Day Prediction
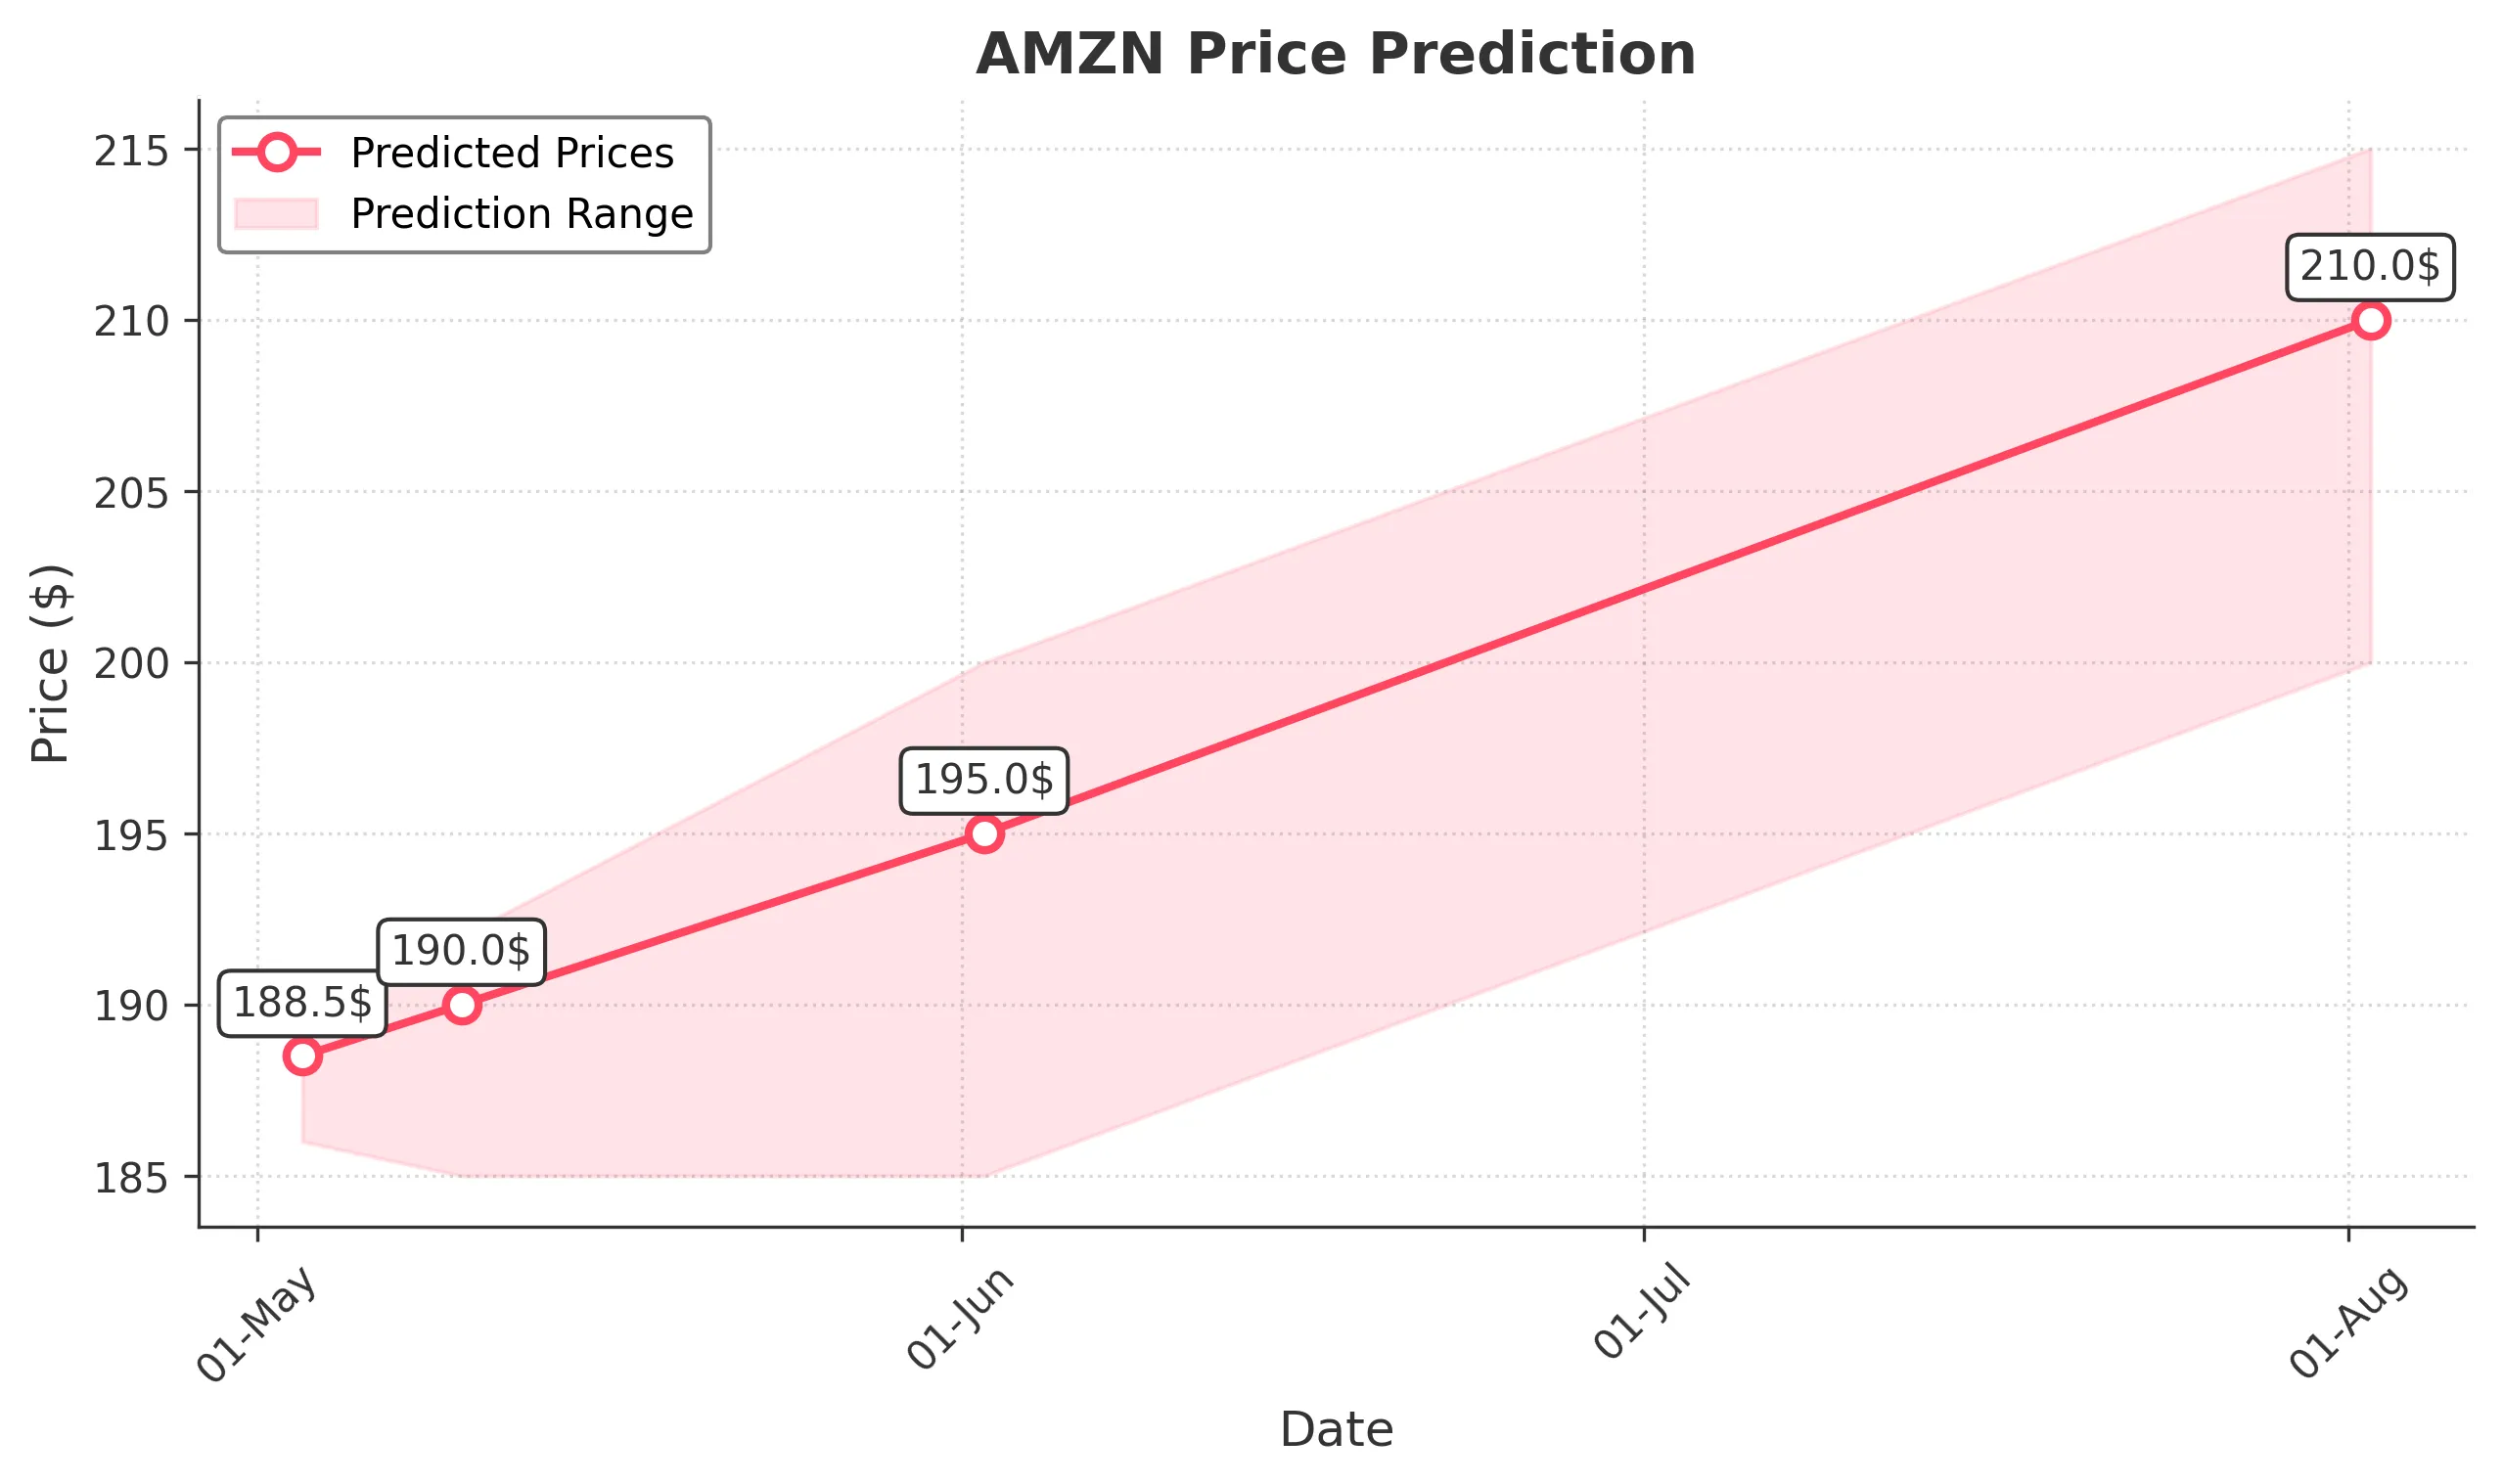
Target: May 3, 2025$188.5
$188
$190
$186
Description
The stock shows a slight bearish trend with recent lower highs and lows. RSI indicates oversold conditions, suggesting a potential bounce. However, MACD is bearish, and volume spikes indicate selling pressure. Expect a close around 188.50.
Analysis
AMZN has been in a bearish trend over the past three months, with significant support around 180. Recent volume spikes indicate selling pressure. Technical indicators like MACD and RSI suggest potential for a short-term bounce, but overall sentiment remains cautious.
Confidence Level
Potential Risks
Market volatility and external news could impact the prediction. A sudden bullish reversal is possible if sentiment shifts.
1 Week Prediction
Target: May 10, 2025$190
$189
$192
$185
Description
A potential recovery is anticipated as the stock approaches key support levels. The RSI may stabilize, and if bullish sentiment builds, we could see a close around 190.00. Watch for volume trends indicating buying interest.
Analysis
The stock has shown signs of consolidation around the 180-190 range. Key resistance is at 200. Technical indicators suggest a possible reversal, but the overall market sentiment remains cautious. Volume patterns indicate potential accumulation.
Confidence Level
Potential Risks
Unforeseen macroeconomic events or earnings reports could lead to volatility. The bearish trend may still dominate if selling pressure continues.
1 Month Prediction
Target: June 2, 2025$195
$194
$200
$185
Description
If the bullish momentum continues, we could see a gradual recovery towards 195.00. The MACD may cross bullish, and RSI could stabilize, indicating a potential trend reversal. Volume should support this move.
Analysis
AMZN has been in a bearish phase, but recent price action suggests a potential bottoming pattern. Key resistance at 200 could be tested if bullish sentiment builds. Technical indicators are mixed, indicating uncertainty in the near term.
Confidence Level
Potential Risks
Market sentiment is fragile, and any negative news could reverse the trend. The potential for further declines remains if selling pressure resumes.
3 Months Prediction
Target: August 2, 2025$210
$208
$215
$200
Description
Assuming a recovery continues, the stock could reach 210.00 as it breaks through resistance levels. Positive earnings or macroeconomic news could support this upward trend. Watch for volume increases.
Analysis
The stock has faced significant selling pressure, but a recovery could be on the horizon if key resistance levels are broken. The overall trend remains bearish, but signs of accumulation and potential bullish reversals are emerging. External factors will play a crucial role in future performance.
Confidence Level
Potential Risks
Long-term predictions are uncertain due to potential market shifts. Economic conditions and company performance will heavily influence the stock's trajectory.