AMZN Trading Predictions
1 Day Prediction
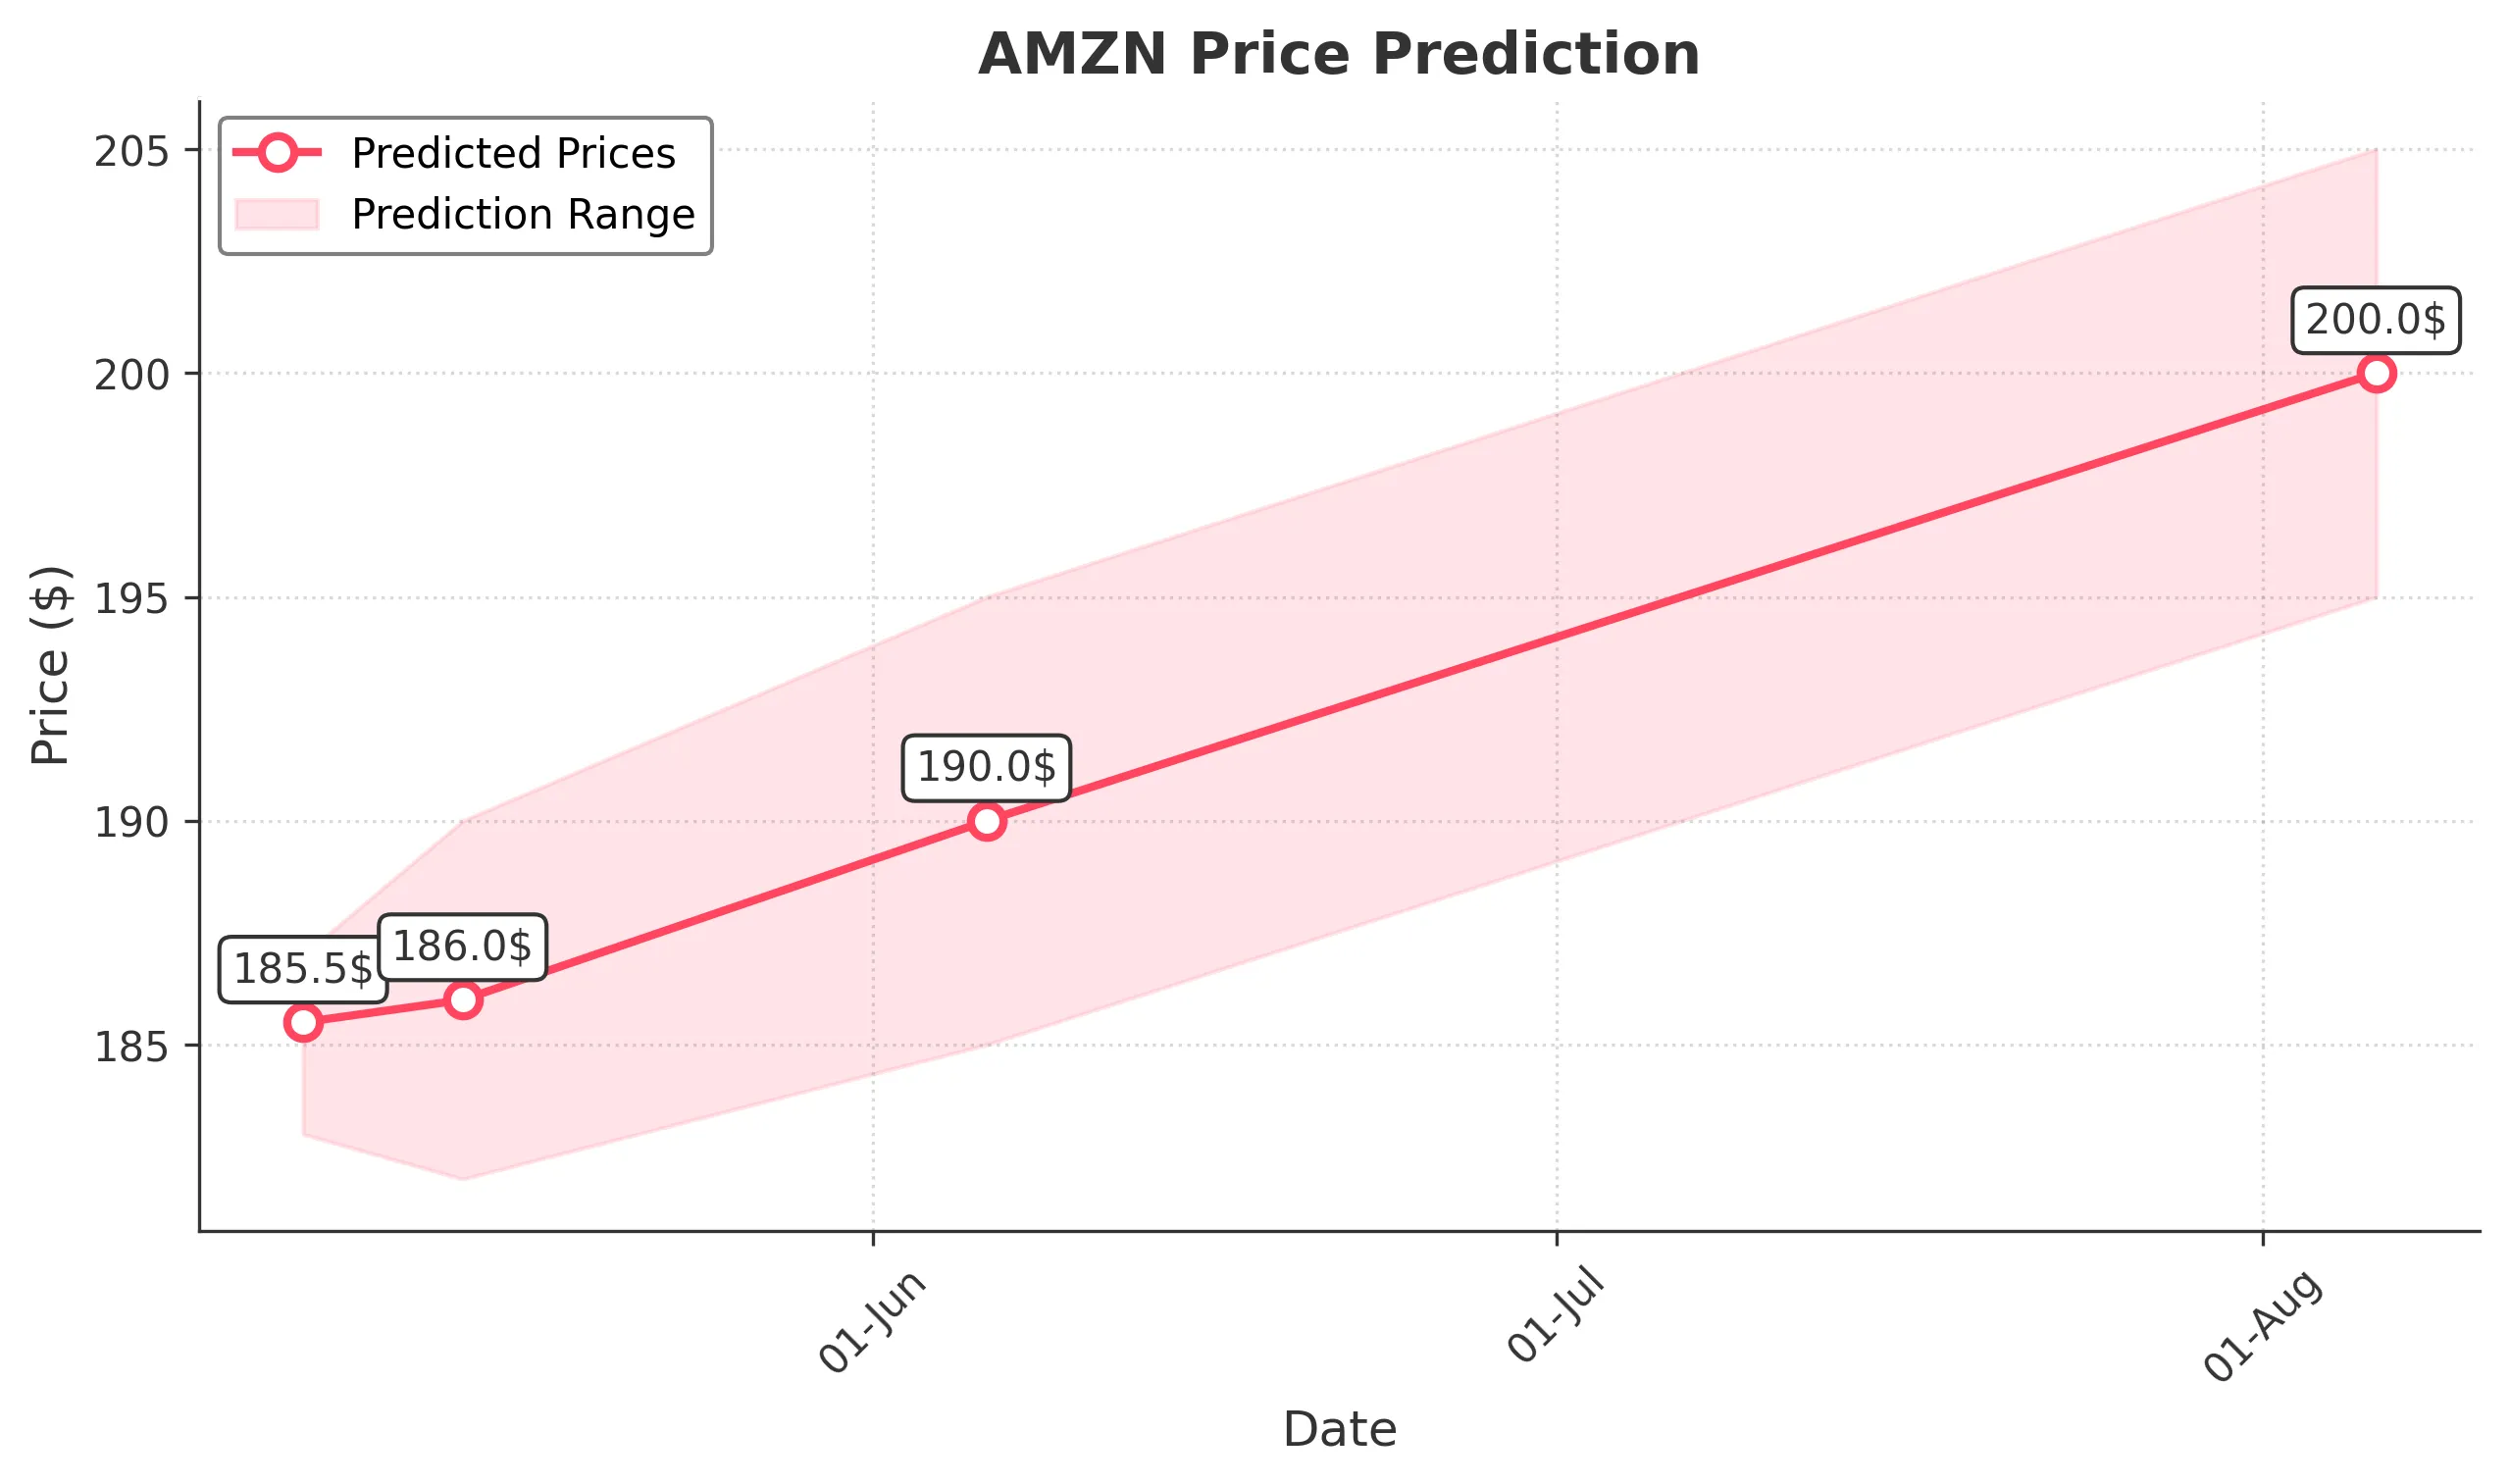
Target: May 7, 2025$185.5
$185
$187
$183
Description
The stock shows a slight bearish trend with recent lower closes. RSI indicates oversold conditions, suggesting a potential bounce. However, MACD is bearish, and volume is declining, indicating caution.
Analysis
AMZN has been in a bearish trend over the past three months, with significant support around $180. Recent candlestick patterns show indecision, and volume has been inconsistent. The overall sentiment is cautious, influenced by macroeconomic factors.
Confidence Level
Potential Risks
Market volatility and external news could impact the prediction. A sudden market shift could lead to unexpected price movements.
1 Week Prediction
Target: May 14, 2025$186
$185.5
$190
$182
Description
Expect a slight recovery as the stock may find support near $180. The RSI is improving, indicating potential upward momentum. However, MACD remains bearish, suggesting caution in bullish expectations.
Analysis
The stock has shown a bearish trend with significant resistance at $190. Volume spikes on down days indicate selling pressure. The market sentiment remains cautious, influenced by broader economic conditions.
Confidence Level
Potential Risks
Potential for further declines exists if market sentiment worsens or if economic indicators are unfavorable.
1 Month Prediction
Target: June 6, 2025$190
$186.5
$195
$185
Description
A potential recovery is anticipated as the stock approaches key Fibonacci retracement levels. The RSI may stabilize, indicating a possible reversal. However, macroeconomic factors could still weigh heavily.
Analysis
AMZN has been trading in a bearish channel, with key support at $180. The stock's volatility remains high, and recent candlestick patterns suggest indecision. Market sentiment is mixed, with external factors influencing investor behavior.
Confidence Level
Potential Risks
Unforeseen economic events or earnings reports could significantly impact the stock's performance.
3 Months Prediction
Target: August 6, 2025$200
$198
$205
$195
Description
If the stock can break above resistance levels, a bullish trend may develop. The MACD could turn positive, and RSI may indicate strength. However, economic conditions remain a significant risk.
Analysis
The stock has shown a bearish trend but may find support at $180. Key resistance levels are around $200. The overall market sentiment is cautious, with external economic factors influencing trading behavior.
Confidence Level
Potential Risks
Long-term predictions are uncertain due to potential market shifts and economic instability.