AMZN Trading Predictions
1 Day Prediction
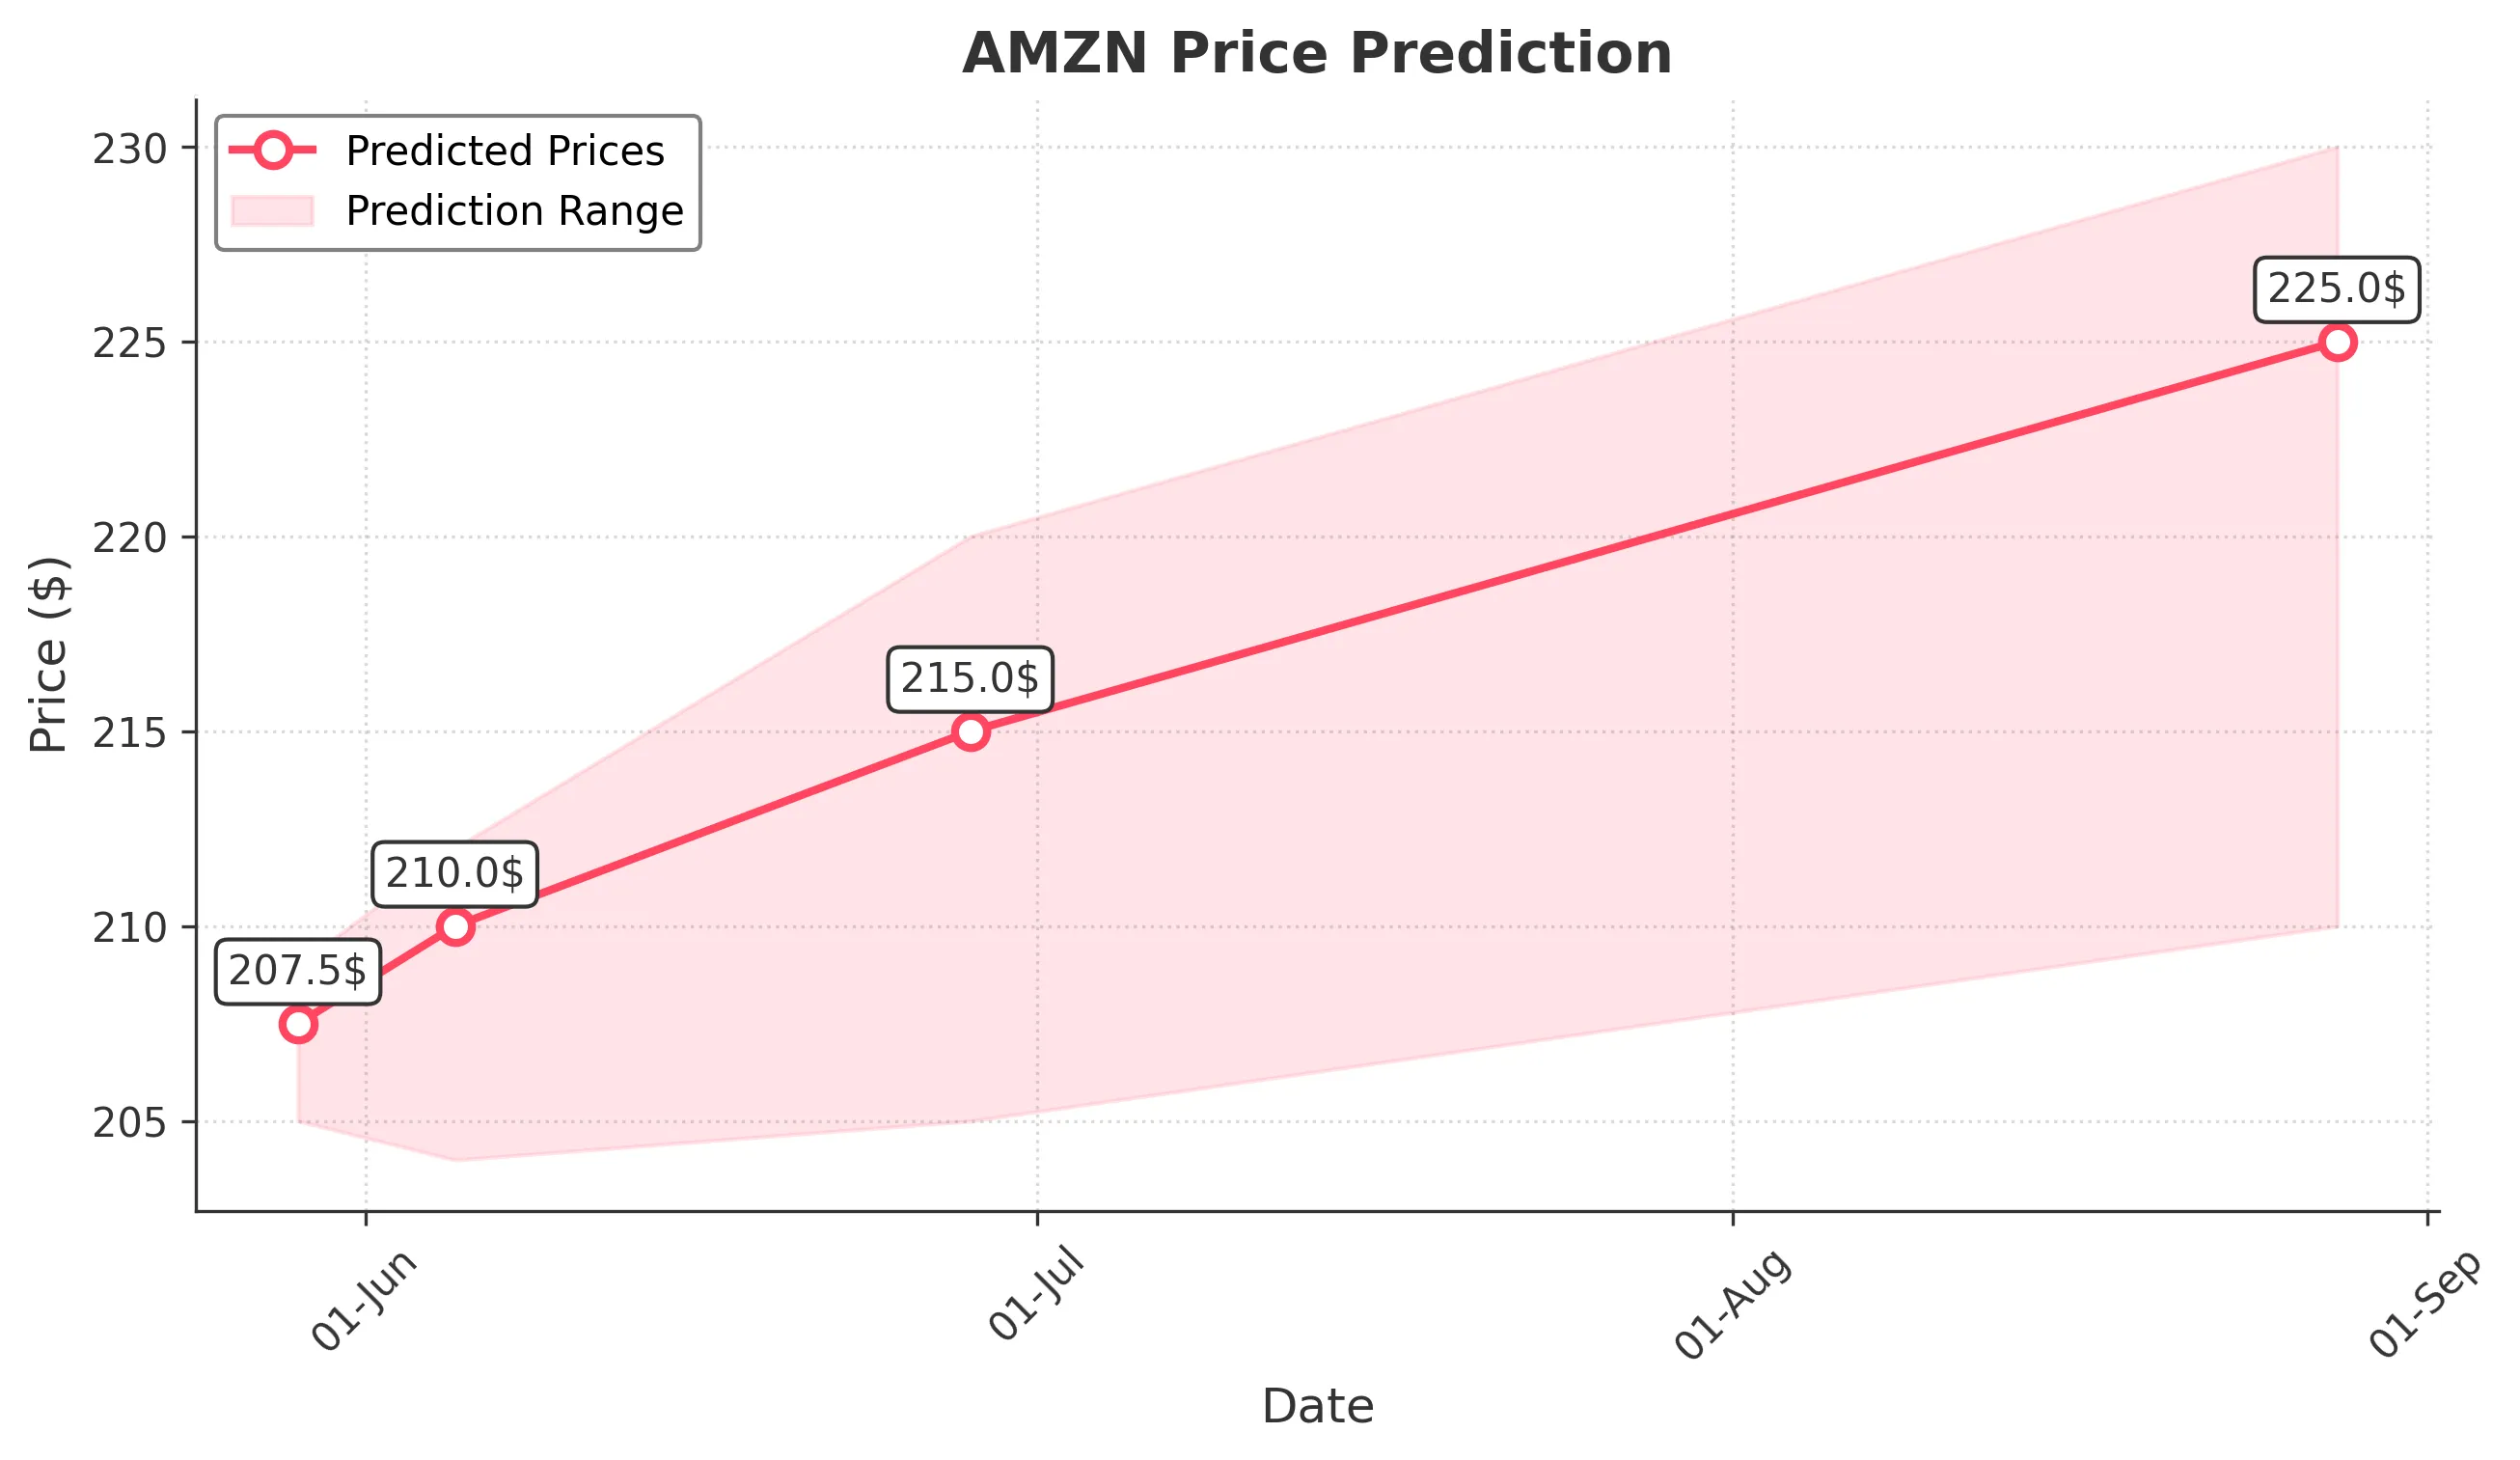
Target: May 29, 2025$207.5
$206.5
$209
$205
Description
The stock shows a slight bullish trend with a recent Doji pattern indicating indecision. RSI is neutral, and MACD is close to crossing above the signal line. Expect a modest increase in price with potential resistance at 209.
Analysis
AMZN has shown a bearish trend recently, with significant support around 200. The RSI indicates a neutral stance, while MACD suggests potential upward momentum. Volume has been inconsistent, indicating uncertainty in market sentiment.
Confidence Level
Potential Risks
Market volatility and external news could impact the prediction. A bearish reversal is possible if the price fails to hold above 206.
1 Week Prediction
Target: June 5, 2025$210
$207.5
$212
$204
Description
A bullish outlook is supported by a recent bullish engulfing pattern. The MACD is showing signs of upward momentum, and the RSI is approaching overbought territory. Expect resistance at 212.
Analysis
The stock has been recovering from recent lows, with key support at 200. The recent price action suggests a bullish reversal, but caution is warranted as the market remains volatile.
Confidence Level
Potential Risks
Potential market corrections or negative news could reverse the trend. Watch for volume spikes that may indicate a shift in sentiment.
1 Month Prediction
Target: June 28, 2025$215
$210
$220
$205
Description
The stock is expected to continue its upward trend, supported by bullish sentiment and a favorable MACD crossover. Fibonacci retracement levels suggest potential resistance at 220.
Analysis
AMZN has shown signs of recovery, with a bullish trend emerging. Key resistance levels are being tested, and the overall market sentiment appears cautiously optimistic, though external factors could impact performance.
Confidence Level
Potential Risks
Economic indicators and earnings reports could introduce volatility. A failure to break above 220 may lead to a pullback.
3 Months Prediction
Target: August 28, 2025$225
$220
$230
$210
Description
Long-term bullish sentiment is supported by strong fundamentals and positive market trends. The stock is likely to test higher resistance levels around 230.
Analysis
Over the past three months, AMZN has experienced volatility with a general bearish trend followed by signs of recovery. Key support levels are around 200, while resistance is seen at 220. The market remains sensitive to external economic conditions.
Confidence Level
Potential Risks
Macroeconomic factors, including interest rates and inflation, could impact the stock's performance. A significant market downturn could reverse the bullish trend.