AMZN Trading Predictions
1 Day Prediction
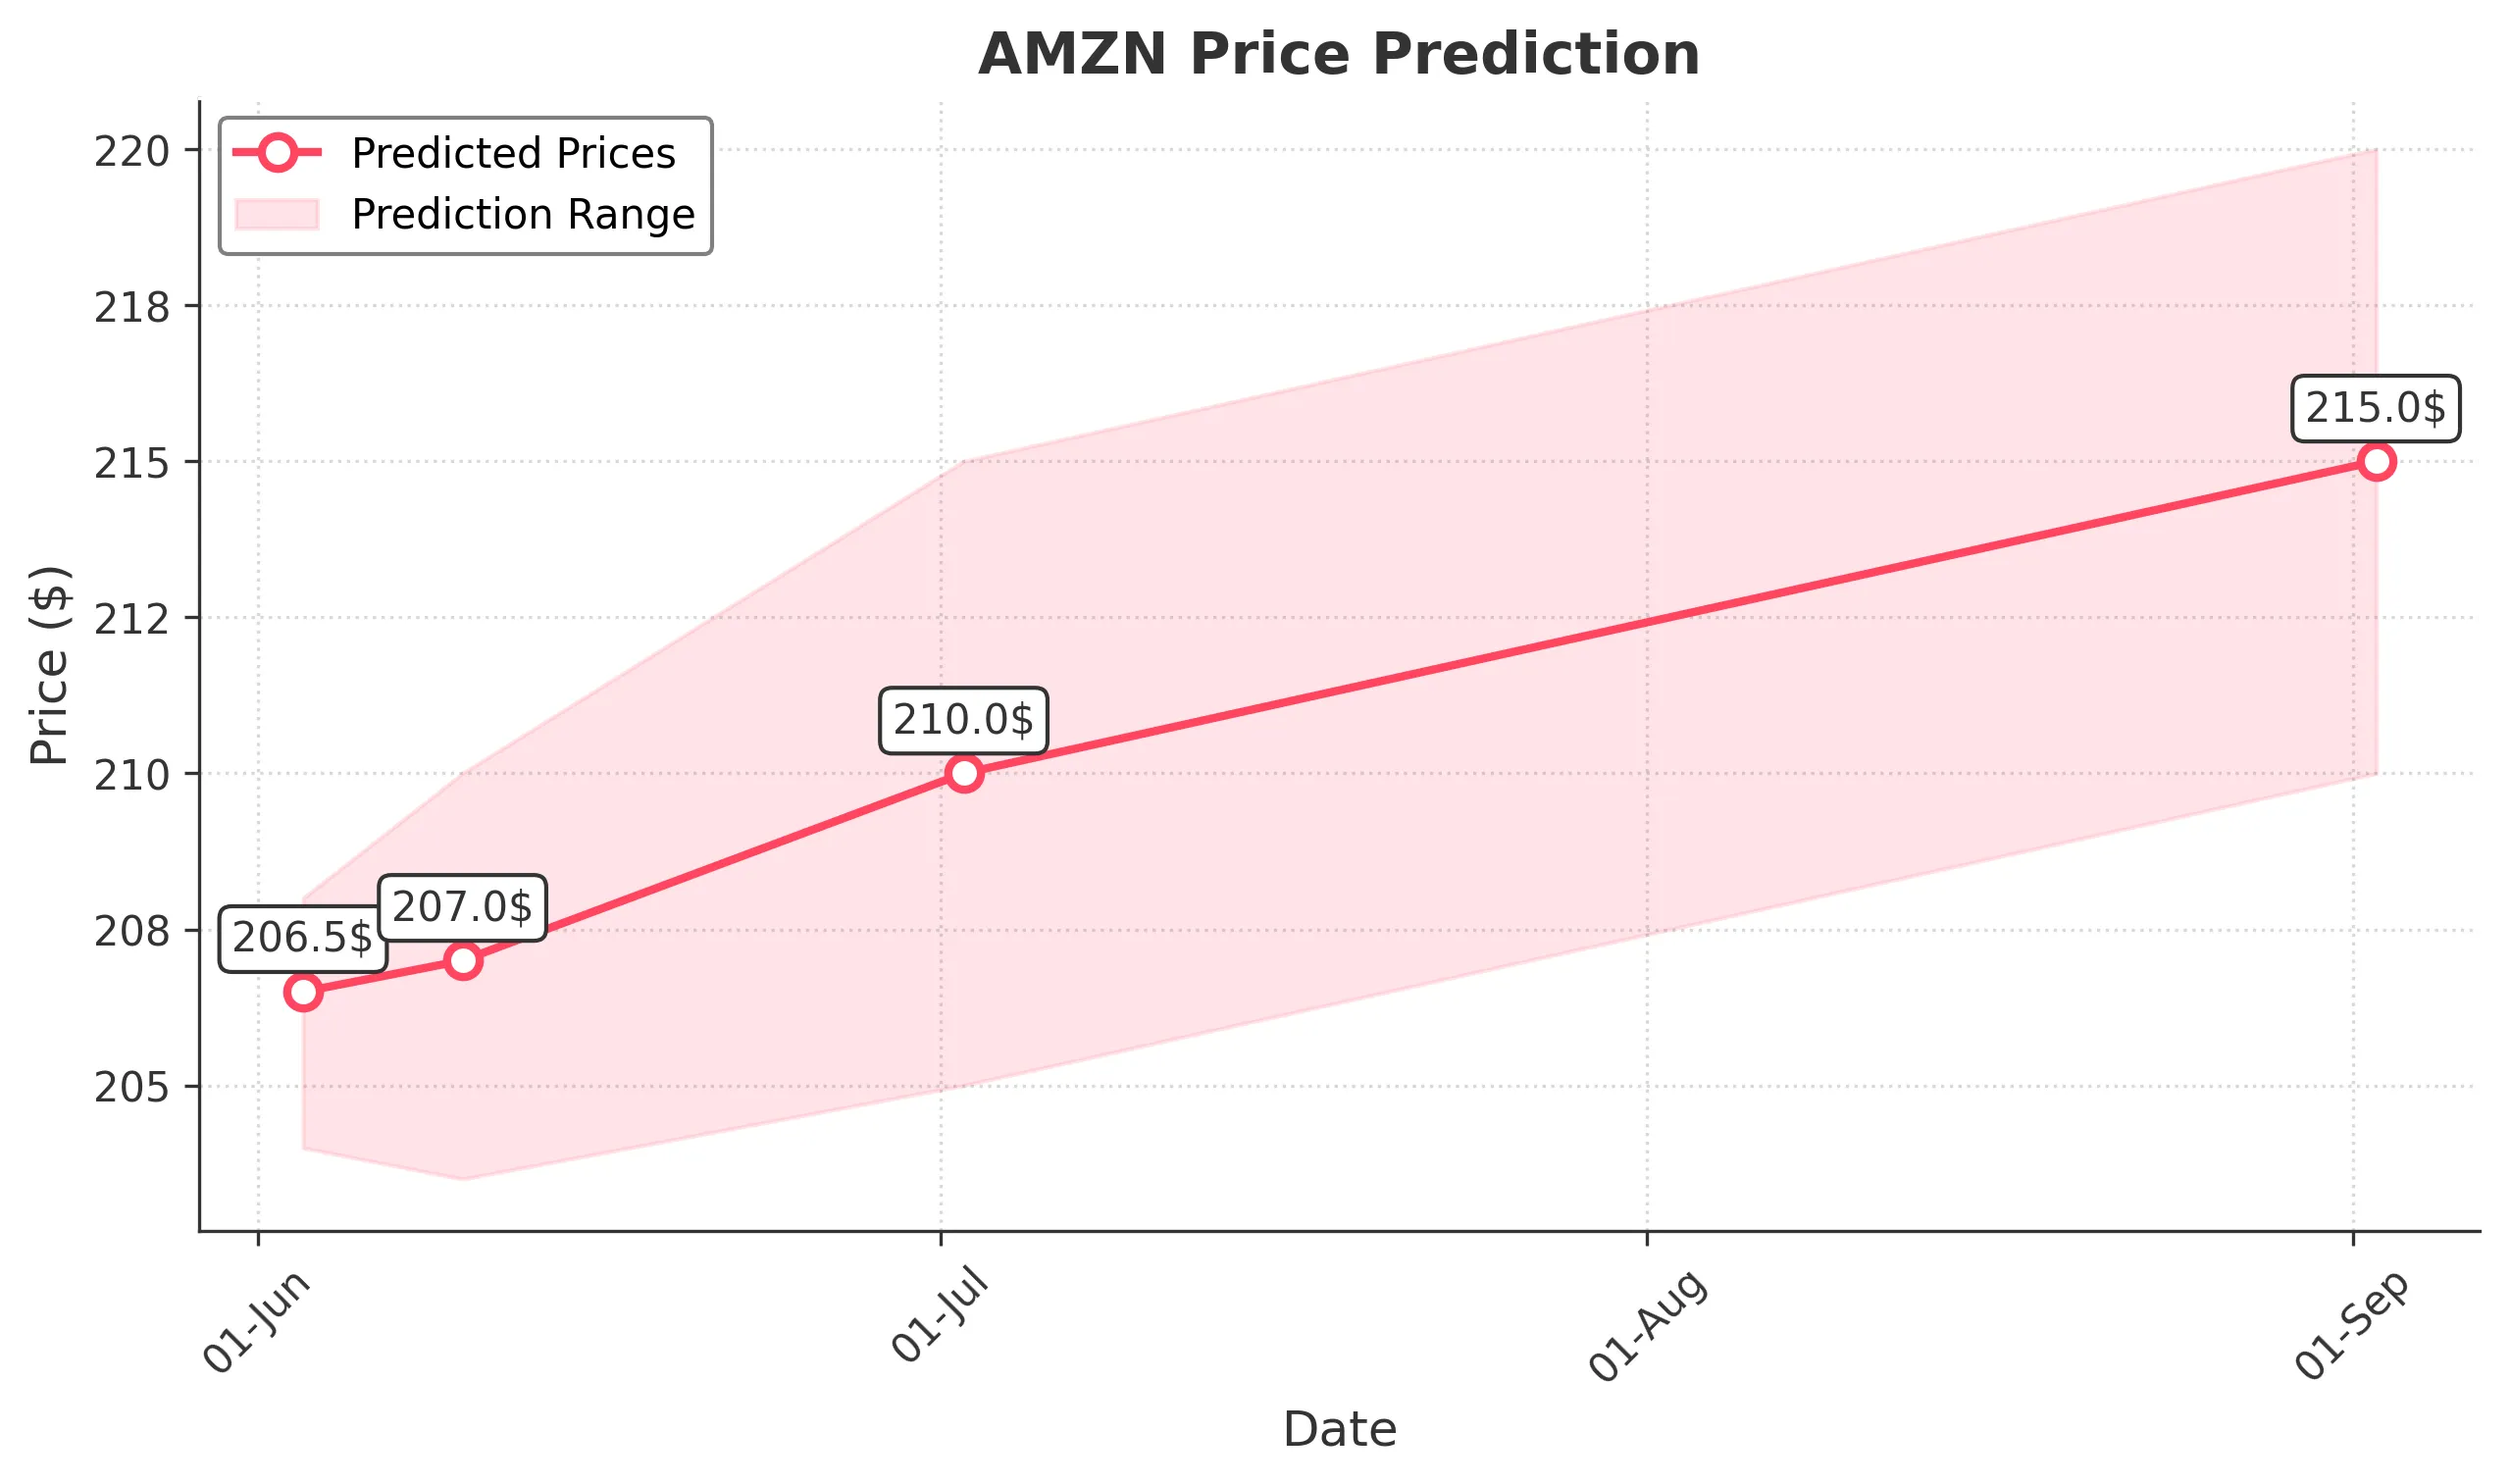
Target: June 3, 2025$206.5
$205.5
$208
$204
Description
The stock shows a slight bullish trend with a recent Doji candlestick indicating indecision. The RSI is near 50, suggesting a neutral momentum. MACD is showing a potential bullish crossover, supporting a modest increase in price.
Analysis
Over the past 3 months, AMZN has experienced significant volatility, with a bearish trend recently. Key support at $200 and resistance at $210. The RSI indicates neutral momentum, while volume spikes suggest increased interest. Overall, the market sentiment remains cautious.
Confidence Level
Potential Risks
Market volatility and external news could impact the prediction. A sudden downturn in market sentiment may lead to a price drop.
1 Week Prediction
Target: June 10, 2025$207
$206
$210
$203.5
Description
The stock is expected to rise slightly as the MACD shows bullish momentum. The recent price action indicates a potential reversal from the recent downtrend. However, the RSI nearing overbought levels may limit upside potential.
Analysis
AMZN has shown a mix of bullish and bearish signals. The recent price action has been volatile, with significant support at $200. The Bollinger Bands indicate potential for a breakout, but caution is advised due to overall market sentiment.
Confidence Level
Potential Risks
Potential for market corrections exists, especially if macroeconomic indicators turn negative. External factors could also influence trading volume.
1 Month Prediction
Target: July 2, 2025$210
$208
$215
$205
Description
A gradual upward trend is anticipated as the stock stabilizes. The Fibonacci retracement levels suggest a target around $210. However, the RSI indicates potential overbought conditions, which could lead to pullbacks.
Analysis
The stock has shown resilience with a recent recovery from lows. Key resistance at $215 and support at $200. The MACD indicates bullish momentum, while volume patterns suggest increased interest. Overall, a cautious bullish outlook is warranted.
Confidence Level
Potential Risks
Economic data releases and earnings reports could introduce volatility. A shift in market sentiment could also impact the stock's performance.
3 Months Prediction
Target: September 2, 2025$215
$212
$220
$210
Description
Long-term bullish sentiment is expected as the stock breaks through resistance levels. The MACD and moving averages indicate a strong upward trend. However, external economic factors could pose risks.
Analysis
AMZN has shown a recovery trend with key support at $200 and resistance at $215. The stock's performance has been influenced by broader market trends and economic indicators. A balanced view suggests potential for growth, but caution is advised due to market uncertainties.
Confidence Level
Potential Risks
Unforeseen macroeconomic events or changes in market sentiment could lead to volatility. Earnings reports may also impact stock performance.