AMZN Trading Predictions
1 Day Prediction
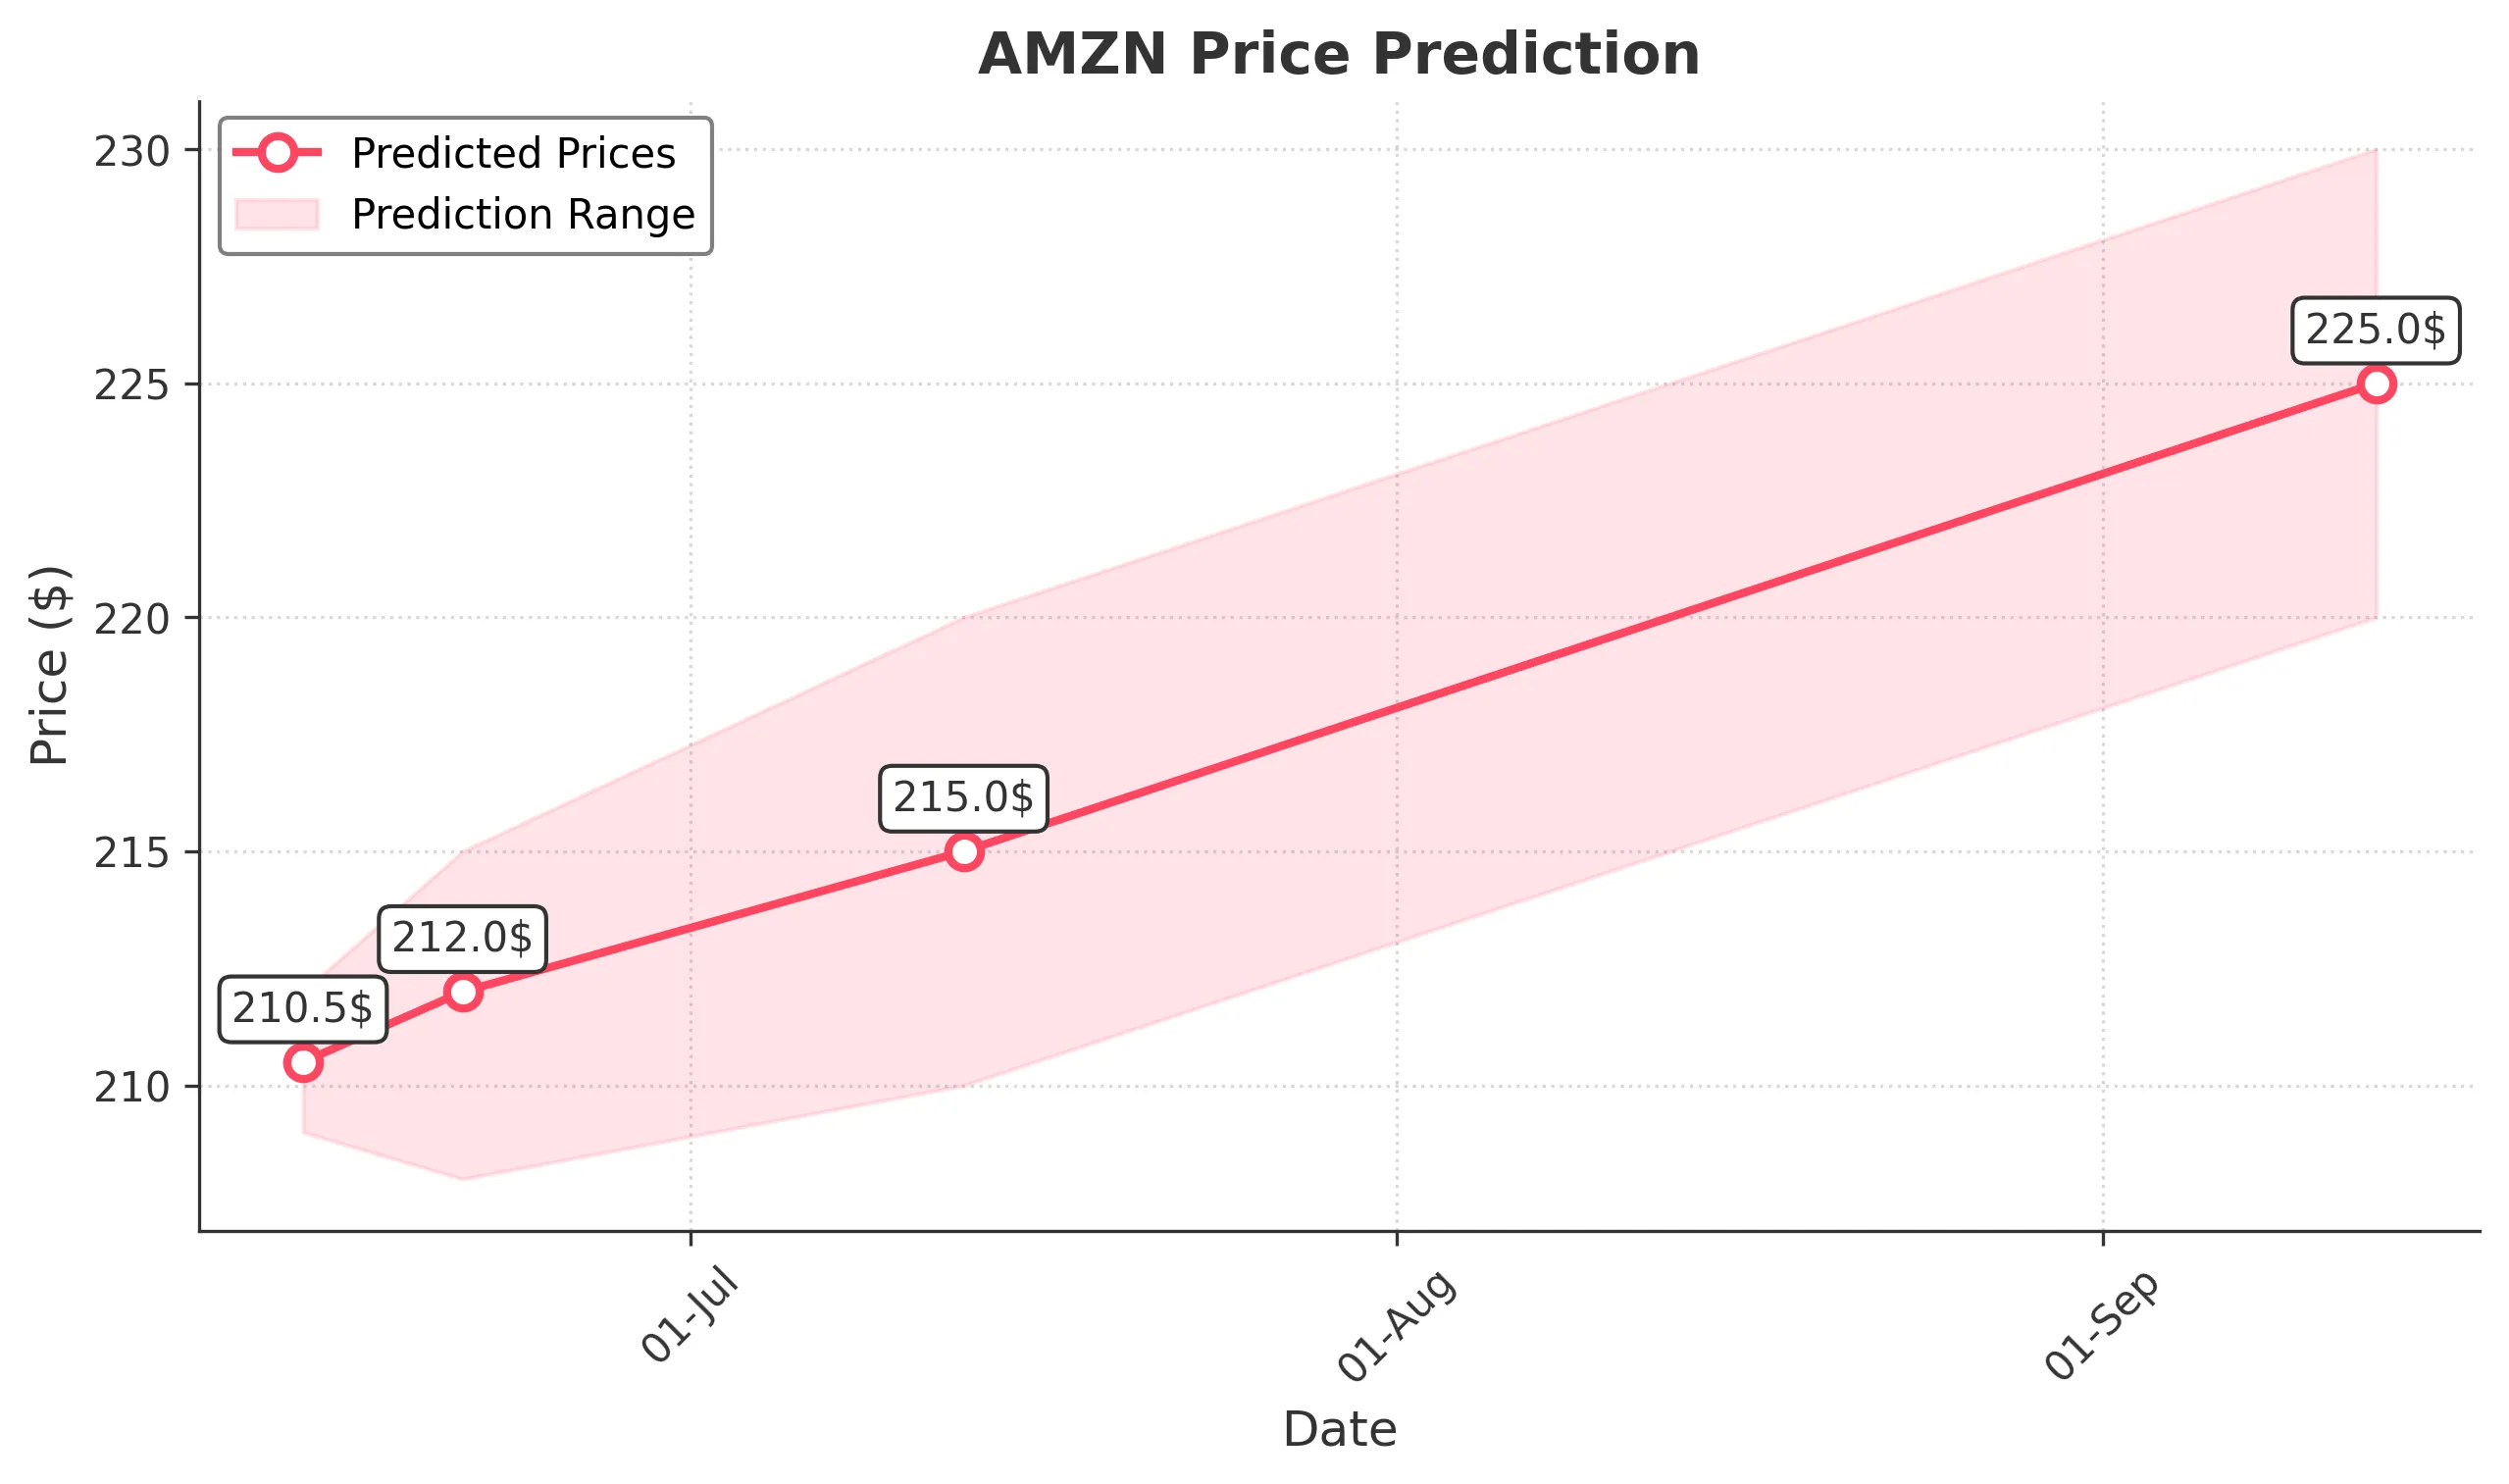
Target: June 14, 2025$210.5
$211
$212
$209
Description
The stock shows a slight bullish trend with a recent Doji candlestick indicating indecision. RSI is neutral, and MACD is close to crossing above the signal line, suggesting potential upward momentum. However, volatility remains a concern.
Analysis
Over the past 3 months, AMZN has shown a bearish trend with significant volatility. Key support at $200 and resistance at $220. Recent volume spikes indicate increased interest, but the overall trend remains cautious. Technical indicators suggest potential for a rebound, but risks persist.
Confidence Level
Potential Risks
Market sentiment could shift due to macroeconomic news or earnings reports, which may impact the stock's performance.
1 Week Prediction
Target: June 21, 2025$212
$210.5
$215
$208
Description
The stock is expected to continue its upward movement as the MACD shows bullish divergence. The RSI is approaching overbought territory, indicating potential for a pullback. Watch for volume trends to confirm the strength of this move.
Analysis
AMZN has been fluctuating with a recent recovery from lows. The stock is facing resistance around $215. Technical indicators suggest a possible upward trend, but external factors could lead to volatility. Volume patterns indicate cautious optimism.
Confidence Level
Potential Risks
Potential market corrections or negative news could reverse the upward trend, impacting the prediction.
1 Month Prediction
Target: July 13, 2025$215
$212
$220
$210
Description
With a bullish trend supported by recent price action and positive market sentiment, AMZN is likely to test resistance at $220. However, the RSI indicates potential overbought conditions, suggesting caution for a pullback.
Analysis
The stock has shown signs of recovery after a bearish phase, with key support at $200. Technical indicators are turning bullish, but caution is warranted due to potential market corrections. Volume trends suggest increased interest, but external factors remain a risk.
Confidence Level
Potential Risks
Economic indicators or earnings reports could introduce volatility, affecting the stock's trajectory.
3 Months Prediction
Target: September 13, 2025$225
$222
$230
$220
Description
If the bullish trend continues, AMZN could reach $225, driven by positive earnings and market sentiment. However, the RSI indicates potential overbought conditions, and any negative news could lead to a sharp correction.
Analysis
AMZN's performance over the past three months has been volatile, with a recent recovery from lows. Key resistance at $230 and support at $200. Technical indicators suggest a potential bullish trend, but external factors could lead to significant fluctuations.
Confidence Level
Potential Risks
Unforeseen macroeconomic events or shifts in market sentiment could significantly impact the stock's performance.