AMZN Trading Predictions
1 Day Prediction
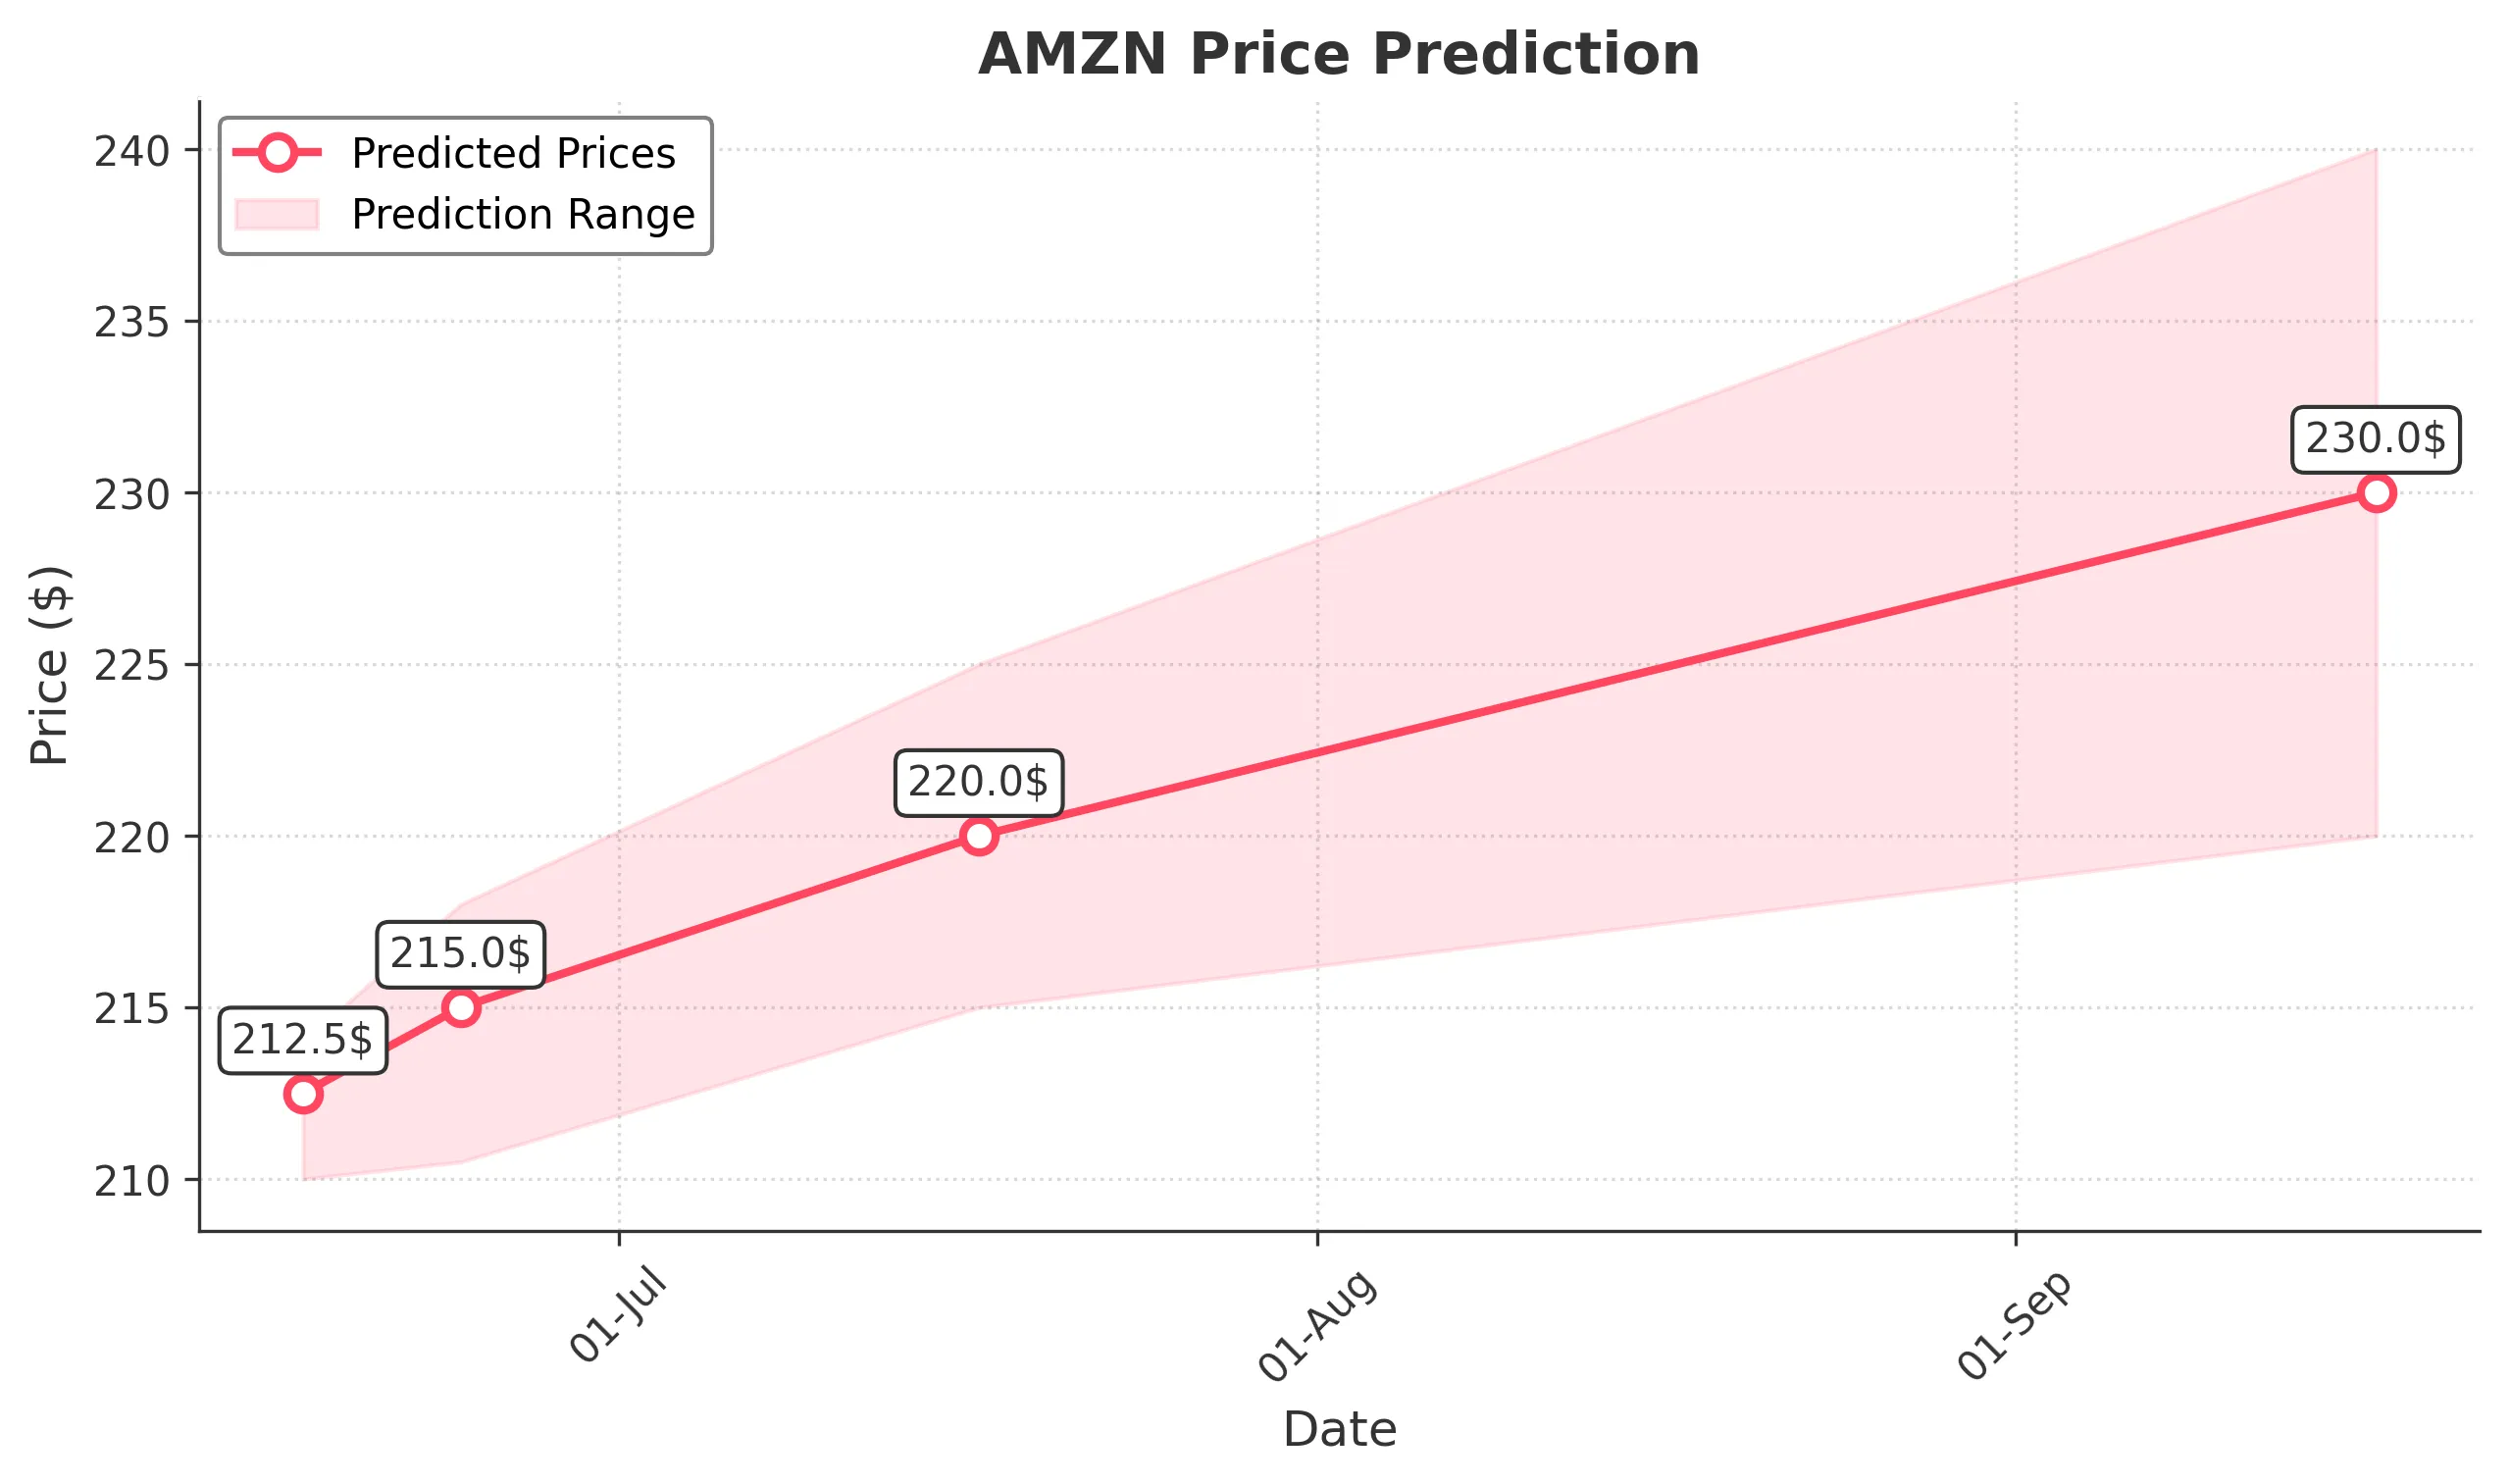
Target: June 17, 2025$212.5
$212
$214
$210
Description
The stock shows a slight bullish trend with a recent Doji candlestick indicating indecision. The RSI is neutral, and MACD is close to crossing above the signal line, suggesting potential upward momentum. However, volatility remains a concern.
Analysis
Over the past 3 months, AMZN has shown a bearish trend with significant volatility. Key support at $200 and resistance at $220. Recent volume spikes indicate increased interest, but the overall trend remains cautious. Technical indicators suggest potential for a rebound, but risks persist.
Confidence Level
Potential Risks
Market sentiment could shift due to macroeconomic news or earnings reports, which may impact the prediction.
1 Week Prediction
Target: June 24, 2025$215
$213.5
$218
$210.5
Description
The stock is expected to continue its upward trajectory as the MACD shows bullish divergence. The RSI is approaching overbought territory, indicating potential for a pullback. Volume is expected to increase as traders react to market sentiment.
Analysis
AMZN has been fluctuating with a recent bullish reversal pattern. Support at $210 and resistance at $220. The stock's performance is influenced by broader market trends and economic indicators, which could lead to volatility.
Confidence Level
Potential Risks
Potential market corrections or negative news could reverse the trend, impacting the accuracy of this prediction.
1 Month Prediction
Target: July 17, 2025$220
$218
$225
$215
Description
With a bullish trend supported by positive earnings expectations, the stock is likely to test resistance levels. The RSI may indicate overbought conditions, suggesting caution. Volume trends indicate strong interest from investors.
Analysis
AMZN has shown signs of recovery with a bullish trend. Key support at $210 and resistance at $225. Technical indicators suggest upward momentum, but external factors could introduce volatility.
Confidence Level
Potential Risks
Unexpected macroeconomic events or earnings misses could lead to volatility and impact the stock's performance.
3 Months Prediction
Target: September 17, 2025$230
$225
$240
$220
Description
The stock is expected to maintain a bullish trend as it approaches key resistance levels. Positive market sentiment and strong earnings could drive prices higher. However, overbought conditions may lead to corrections.
Analysis
AMZN has been on a recovery path with bullish signals from technical indicators. Key support at $220 and resistance at $240. The stock's performance is influenced by broader market trends and economic conditions, which could introduce risks.
Confidence Level
Potential Risks
Market volatility and potential economic downturns could impact the stock's performance, leading to unexpected price movements.