AMZN Trading Predictions
1 Day Prediction
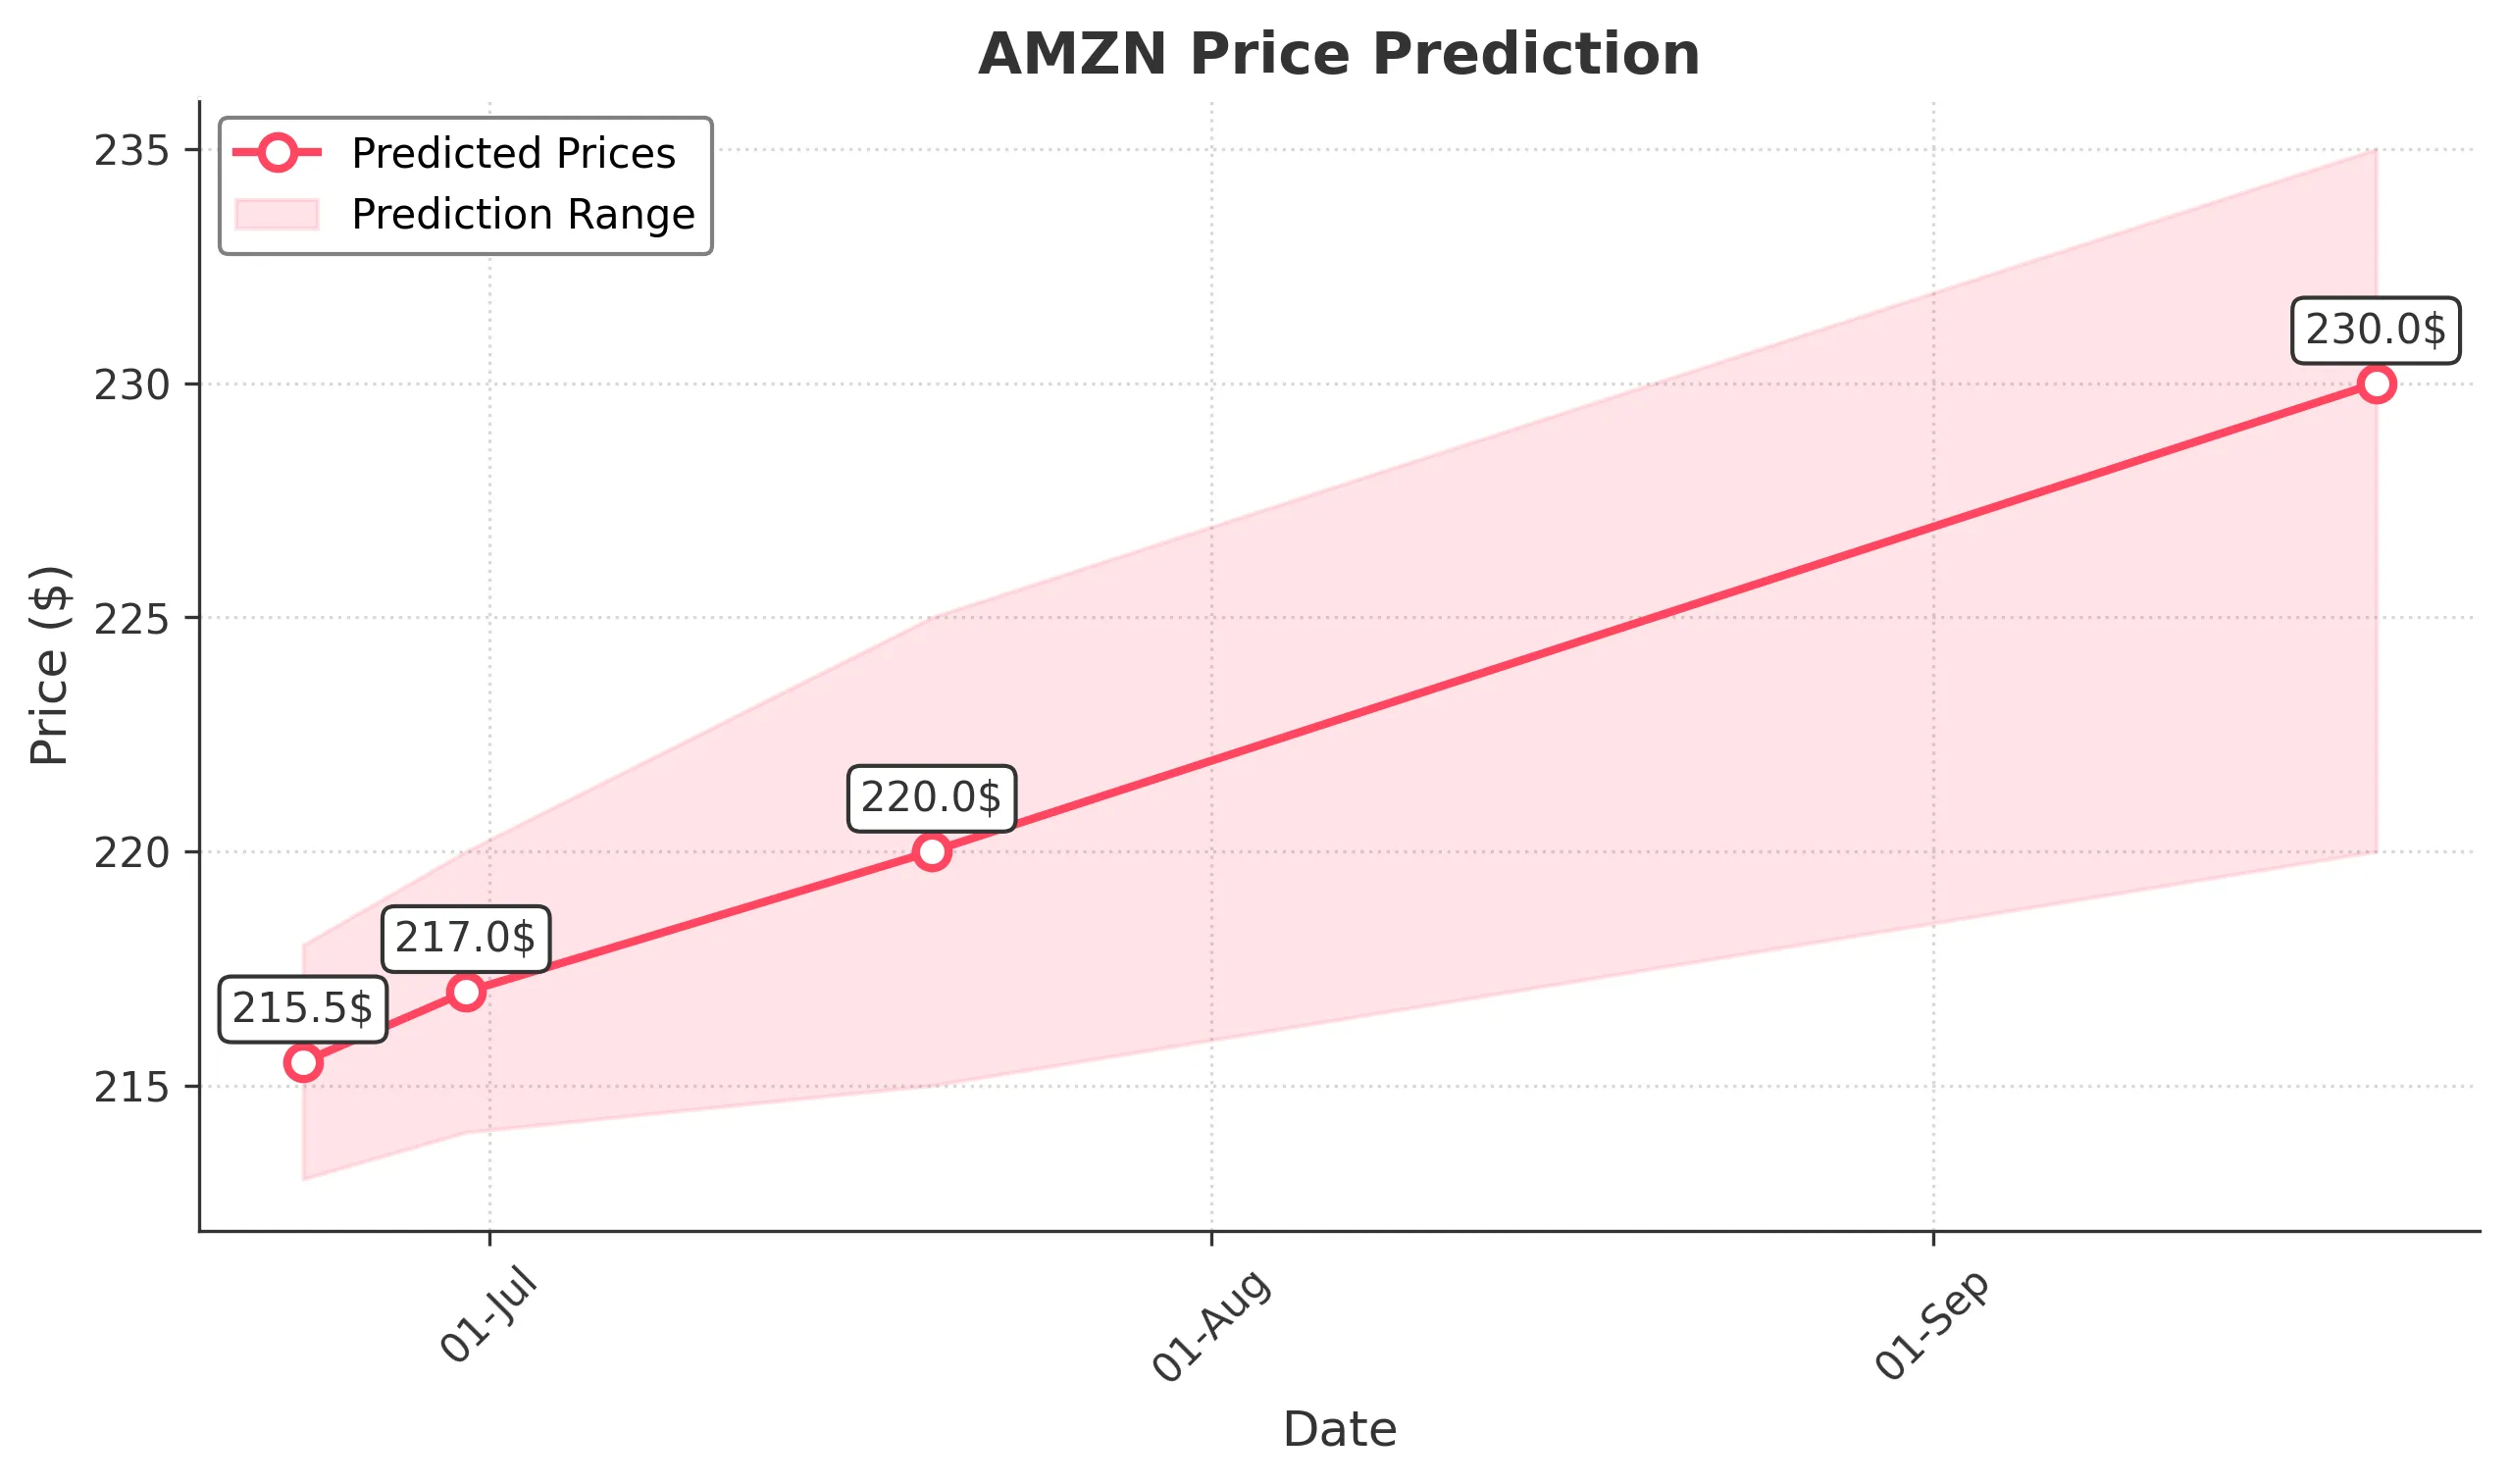
Target: June 23, 2025$215.5
$214.5
$218
$213
Description
The stock shows a bullish trend with a recent upward movement. The RSI is approaching overbought levels, indicating potential for a pullback. However, MACD remains positive, suggesting continued momentum. Volume is stable, supporting the price action.
Analysis
AMZN has shown a bullish trend over the past three months, with significant support at $210 and resistance around $220. The recent price action indicates a recovery from a dip, supported by increasing volume. Technical indicators like MACD and moving averages suggest upward momentum, but RSI indicates caution.
Confidence Level
Potential Risks
Potential market volatility and external news could impact the prediction.
1 Week Prediction
Target: June 30, 2025$217
$215.5
$220
$214
Description
The stock is expected to maintain its upward trajectory, supported by strong buying interest. The Bollinger Bands indicate potential for price expansion. However, the RSI suggests caution as it approaches overbought territory.
Analysis
Over the past three months, AMZN has experienced a bullish trend with key support at $210. The MACD indicates positive momentum, while volume spikes during upward movements suggest strong buying interest. However, the stock is nearing overbought conditions, which could lead to a pullback.
Confidence Level
Potential Risks
Market sentiment could shift due to macroeconomic factors, affecting the stock's performance.
1 Month Prediction
Target: July 20, 2025$220
$218
$225
$215
Description
The stock is likely to continue its upward trend, driven by positive market sentiment and strong earnings reports. The Fibonacci retracement levels suggest a target around $220, with potential resistance at $225.
Analysis
AMZN has shown resilience with a bullish trend, supported by strong volume and positive technical indicators. Key resistance levels are at $225, while support remains at $210. The market sentiment is generally positive, but external factors could introduce uncertainty.
Confidence Level
Potential Risks
Earnings reports and macroeconomic data releases could introduce volatility.
3 Months Prediction
Target: September 20, 2025$230
$225
$235
$220
Description
Long-term bullish sentiment is expected to drive the stock higher, with potential catalysts from new product launches and market expansion. However, the stock may face resistance at $235, and profit-taking could occur.
Analysis
AMZN's performance over the past three months has been characterized by a bullish trend, with significant support at $210. The stock is approaching key resistance levels, and while the long-term outlook remains positive, potential market corrections could impact short-term performance.
Confidence Level
Potential Risks
Market conditions and economic indicators could lead to unexpected volatility.