AMZN Trading Predictions
1 Day Prediction
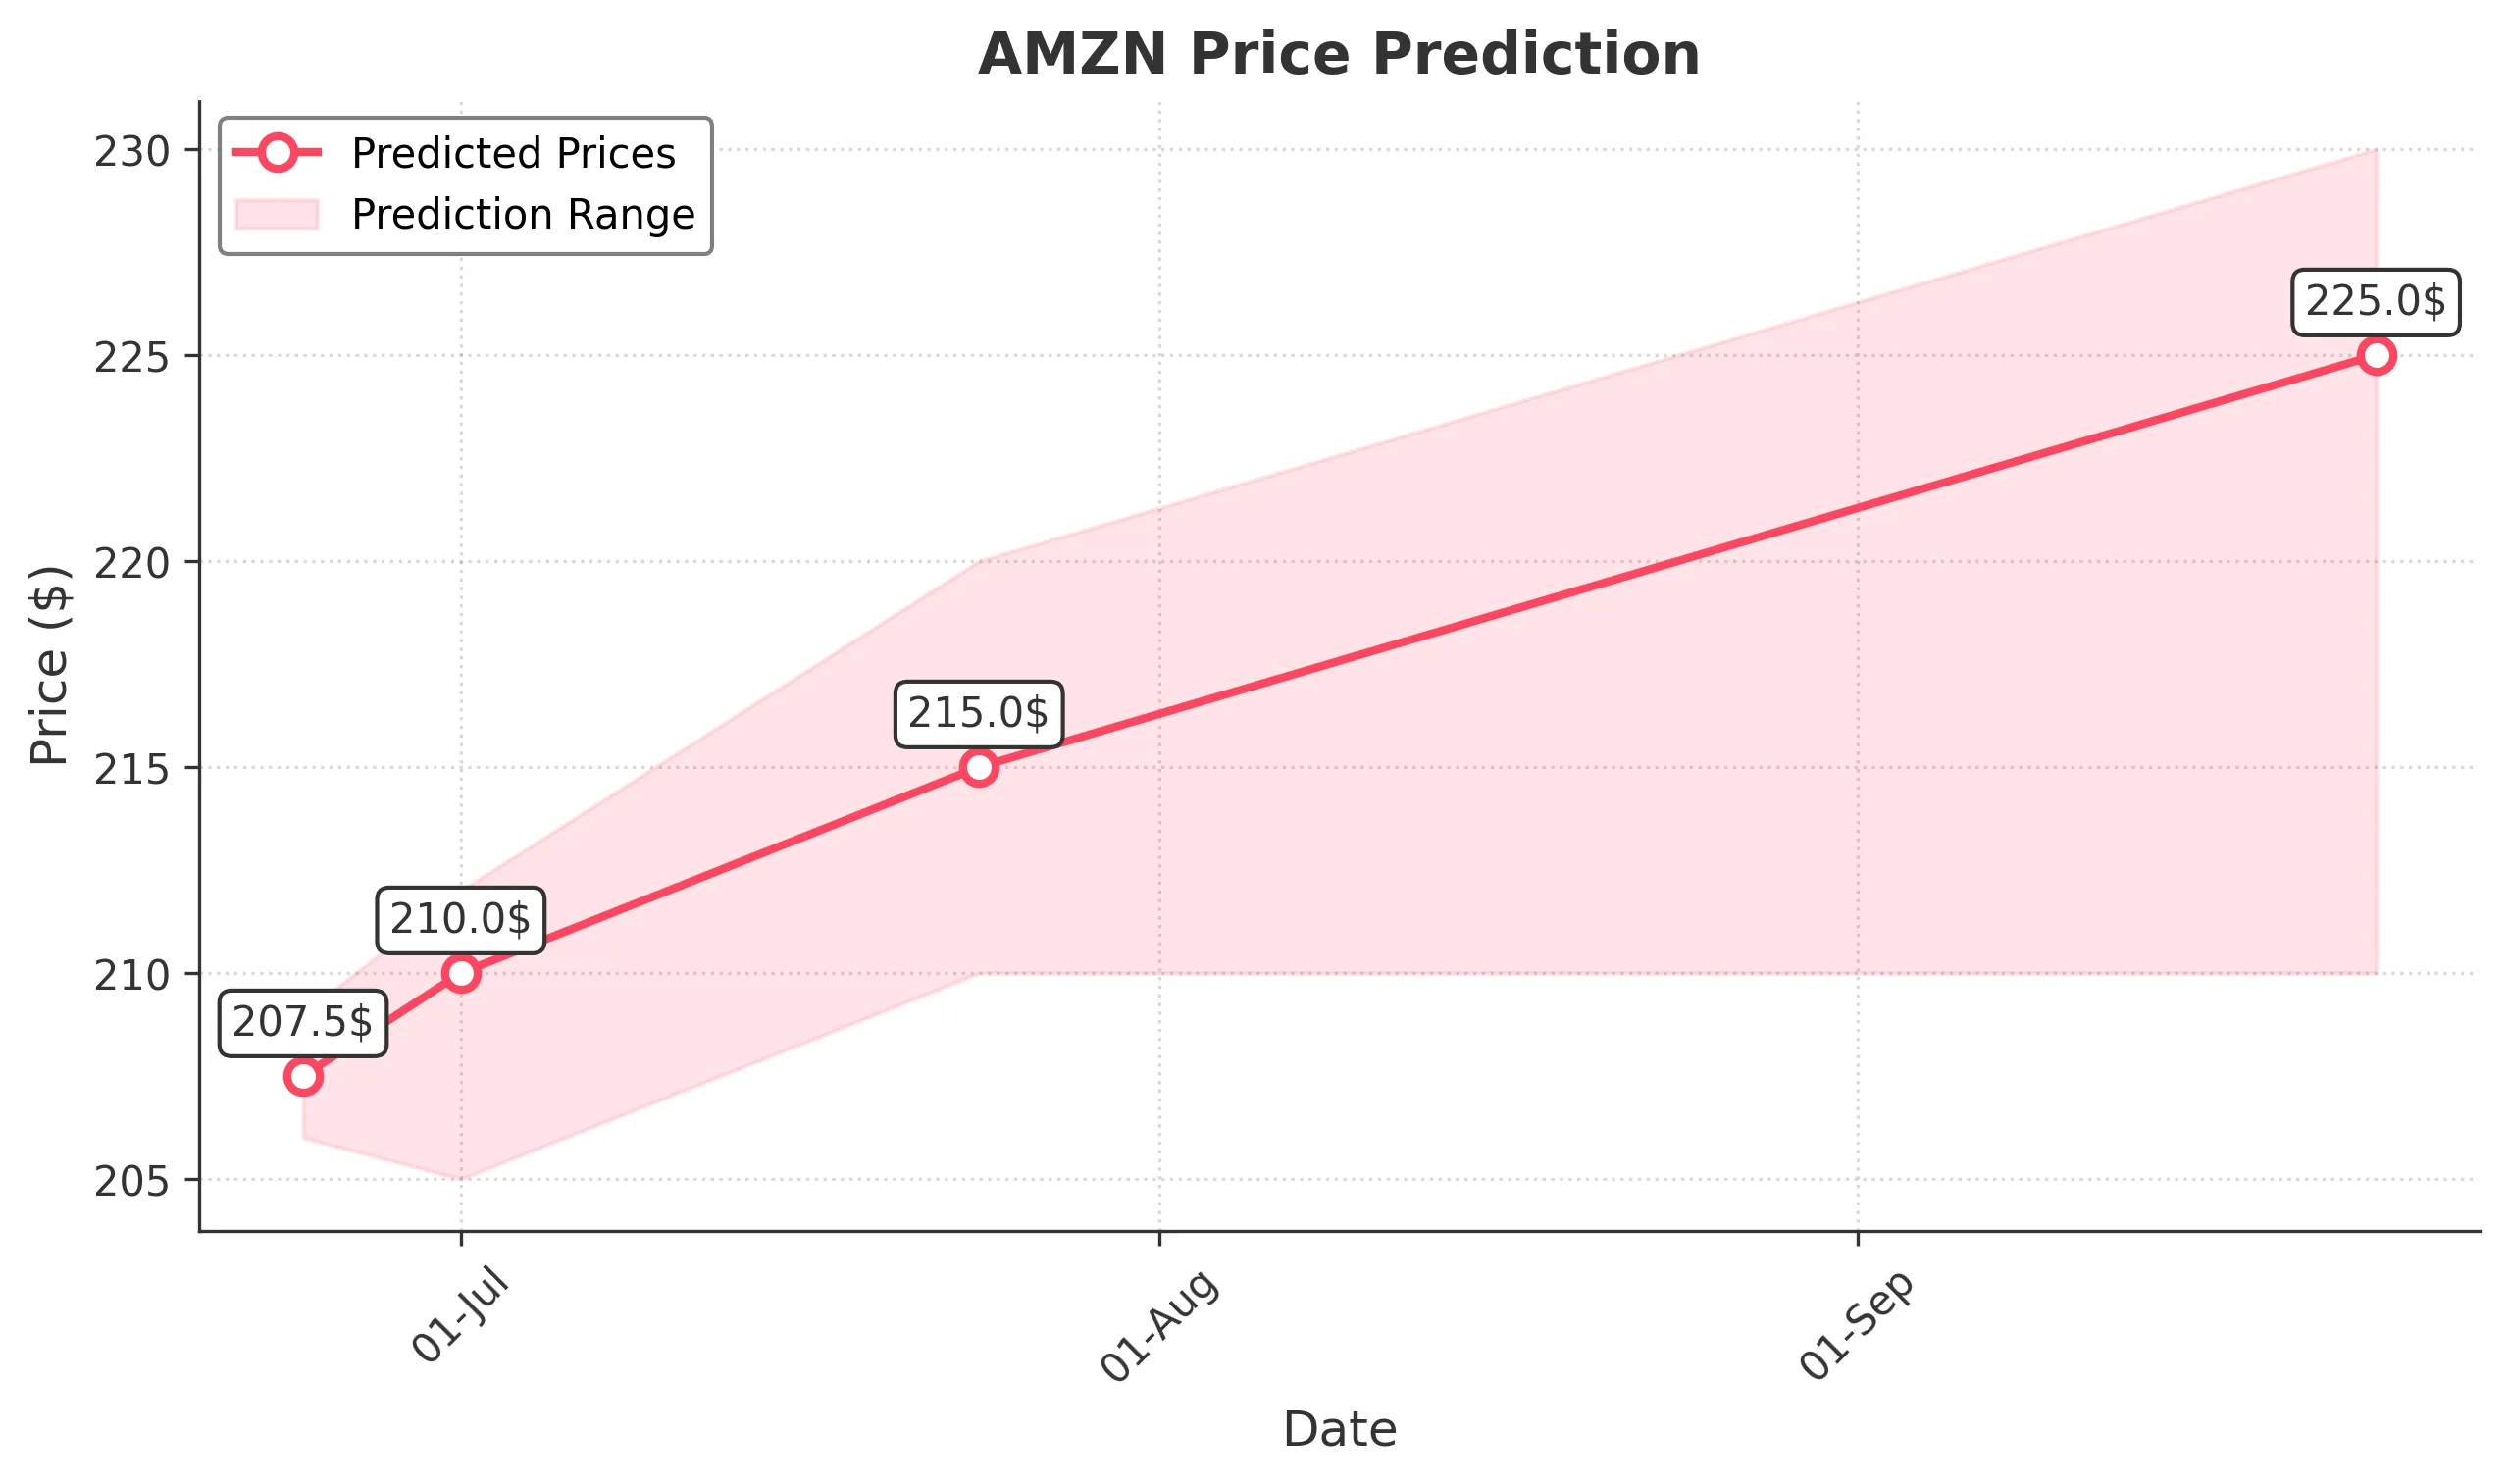
Target: June 24, 2025$207.5
$208.050003
$209
$206
Description
The stock shows a slight bullish trend with a potential close around 207.50. The RSI is neutral, and MACD indicates a potential upward momentum. However, recent volatility suggests caution.
Analysis
AMZN has shown a bearish trend recently, with significant support at 206.00. The RSI is hovering around neutral, indicating indecision. Volume has been decreasing, suggesting a lack of strong conviction in either direction.
Confidence Level
Potential Risks
Market sentiment could shift due to macroeconomic news or earnings reports, which may impact the price.
1 Week Prediction
Target: July 1, 2025$210
$207.5
$212
$205
Description
Expecting a close around 210.00 as the stock may find support at 206.00. The MACD shows a bullish crossover, and the Bollinger Bands suggest potential upward movement.
Analysis
The stock has been trading sideways with resistance at 212.00. The ATR indicates moderate volatility, and recent candlestick patterns suggest indecision. Volume spikes on up days indicate bullish interest.
Confidence Level
Potential Risks
Potential market corrections or external economic factors could lead to unexpected price movements.
1 Month Prediction
Target: July 24, 2025$215
$210
$220
$210
Description
A potential close of 215.00 is anticipated as the stock may break through resistance levels. The MACD and RSI indicate bullish momentum, but caution is advised due to market volatility.
Analysis
AMZN has shown signs of recovery, with key resistance at 220.00. The stock's performance has been mixed, with volume patterns indicating a lack of strong conviction. The market sentiment remains cautious.
Confidence Level
Potential Risks
Unforeseen macroeconomic events or earnings surprises could lead to significant price fluctuations.
3 Months Prediction
Target: September 24, 2025$225
$220
$230
$210
Description
Expecting a close around 225.00 as the stock may continue its upward trajectory. The Fibonacci retracement levels suggest potential support at 210.00, while bullish patterns are forming.
Analysis
The stock has been in a recovery phase, with key support at 210.00. The MACD indicates potential bullish momentum, but the overall market sentiment remains cautious. Volume patterns suggest a lack of strong buying interest.
Confidence Level
Potential Risks
Market volatility and external economic factors could impact the stock's performance significantly.