AMZN Trading Predictions
1 Day Prediction
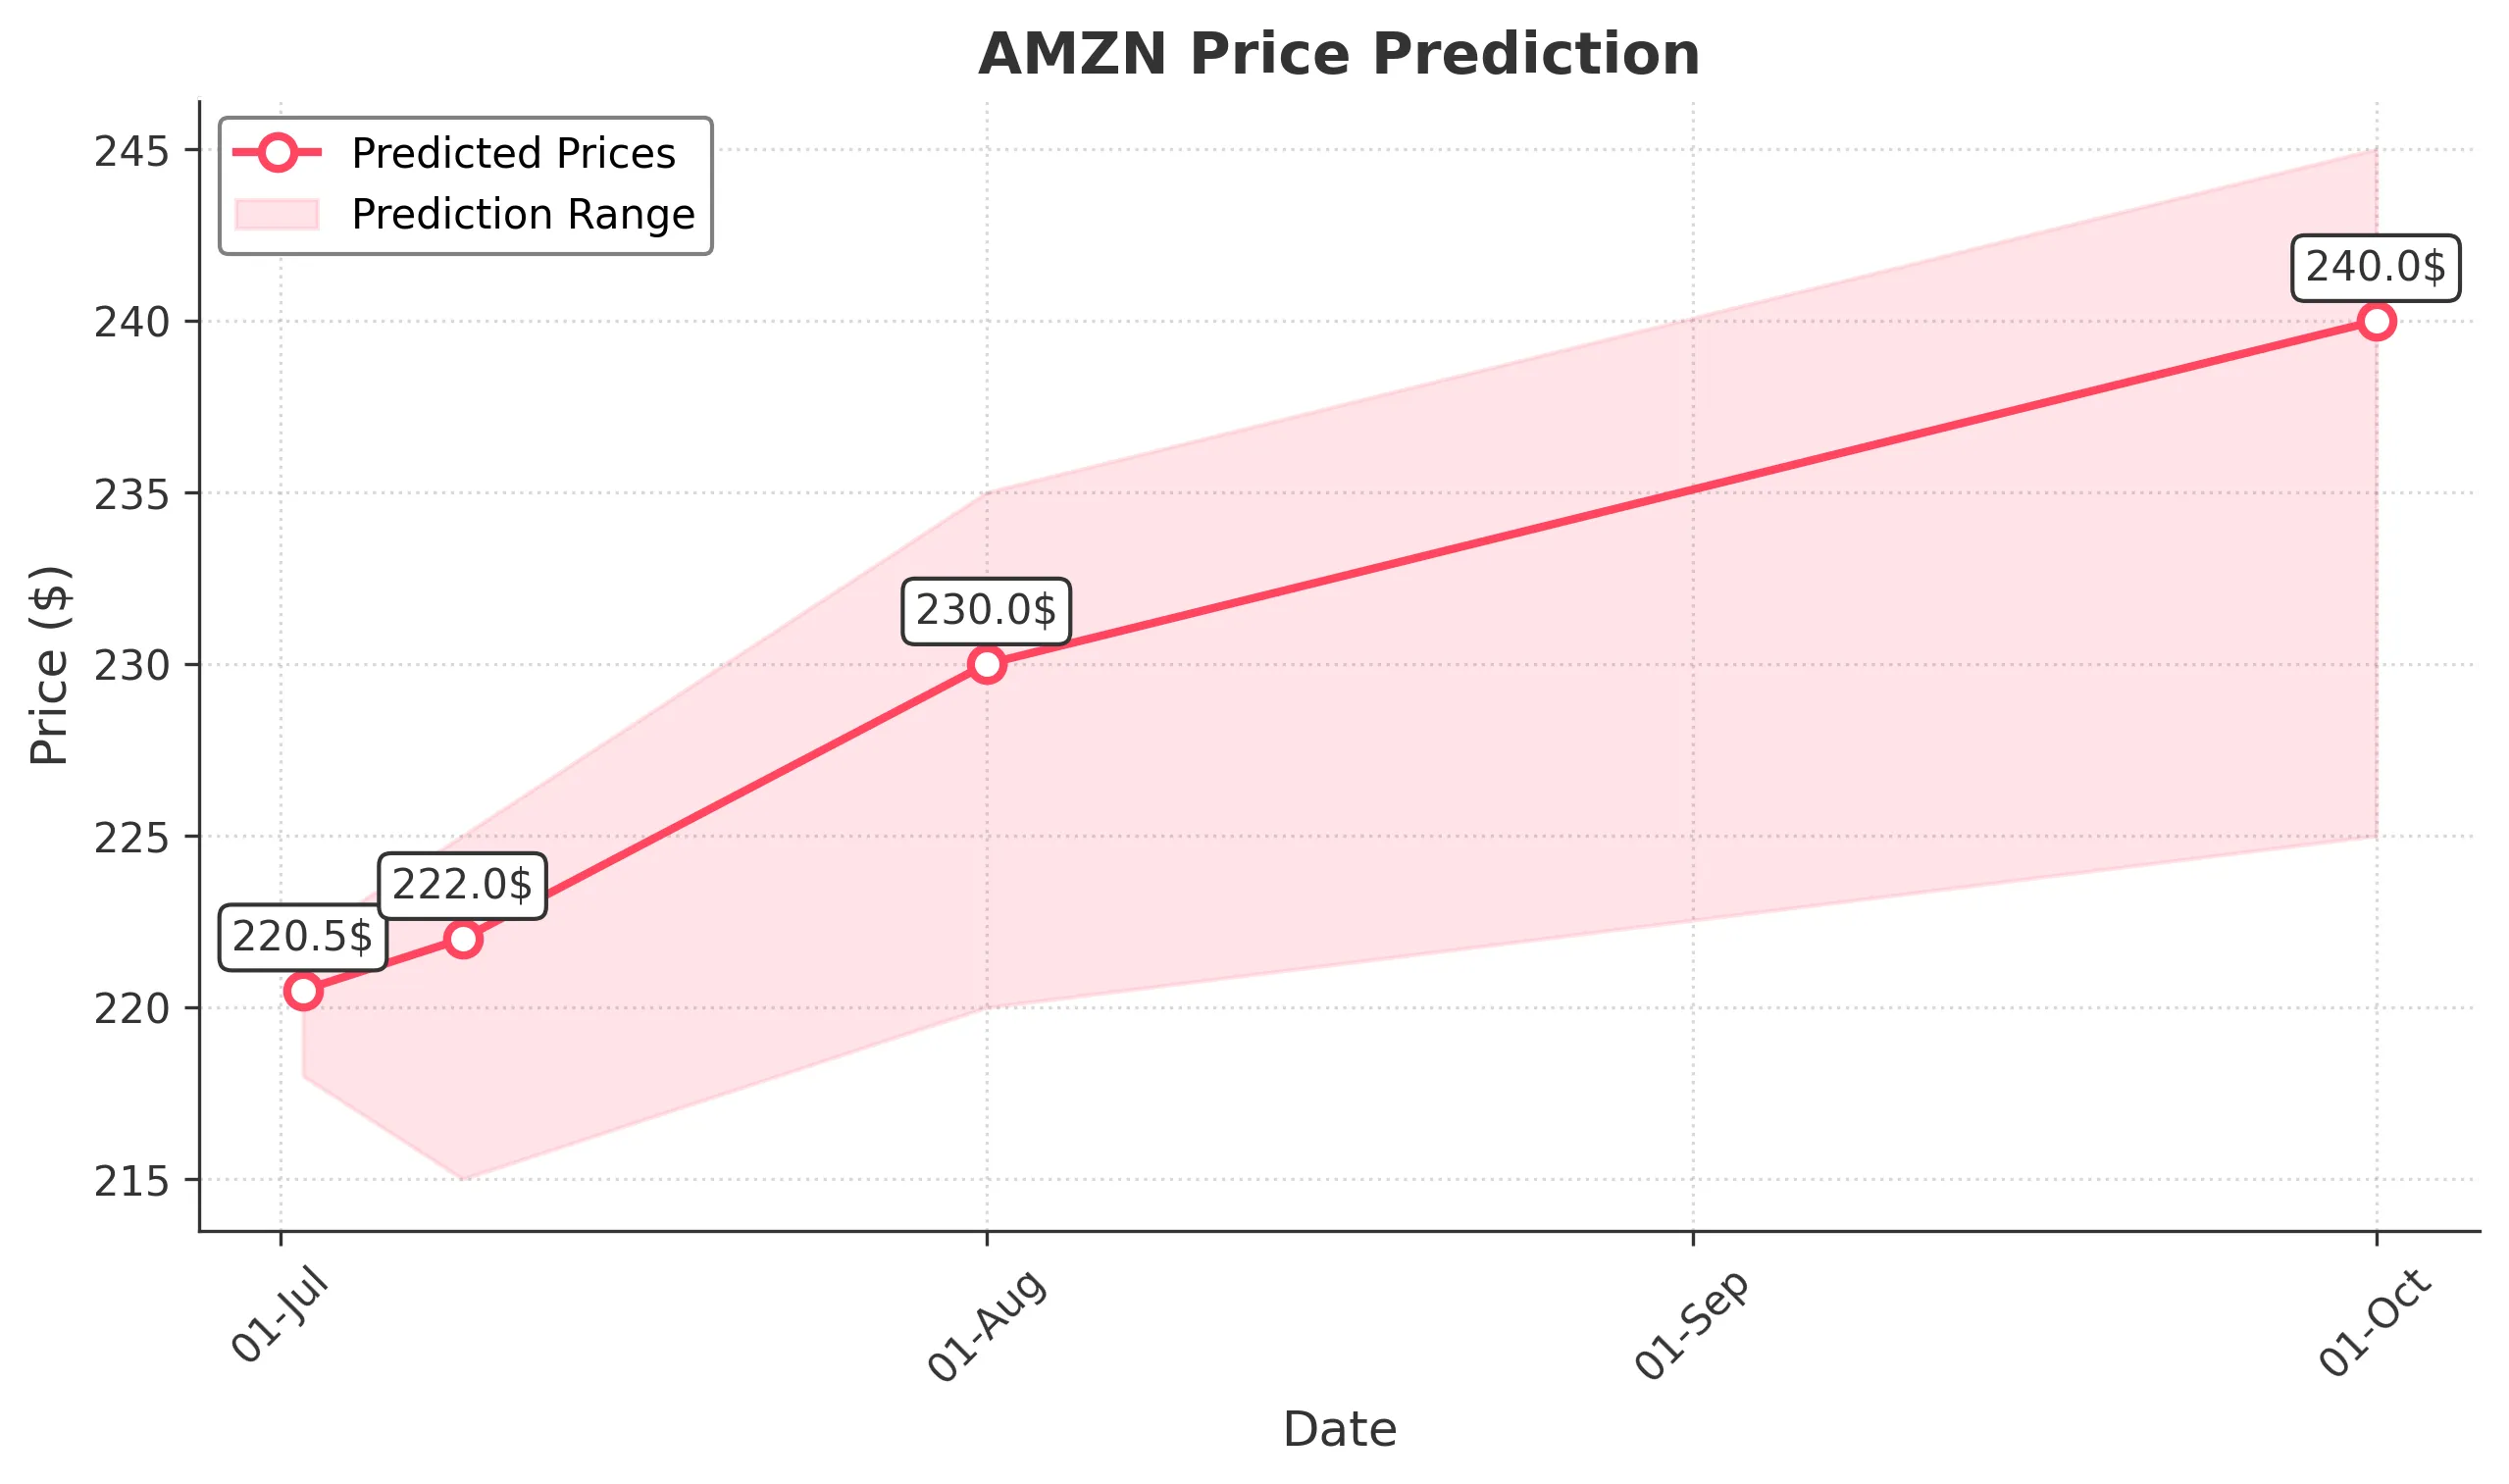
Target: July 2, 2025$220.5
$219.5
$222
$218
Description
The stock shows a bullish trend with a recent upward movement. The RSI is approaching overbought levels, indicating potential for a pullback. However, the MACD is positive, suggesting continued momentum. Expect slight volatility due to market sentiment.
Analysis
AMZN has shown a bullish trend over the past three months, with significant support at $210 and resistance around $220. The recent price action indicates a recovery from a dip, supported by increasing volume. The MACD and moving averages suggest upward momentum, but caution is warranted due to potential overbought conditions.
Confidence Level
Potential Risks
Potential for a pullback if RSI exceeds overbought levels. Market sentiment could shift due to external news.
1 Week Prediction
Target: July 9, 2025$222
$220.5
$225
$215
Description
The stock is expected to maintain its upward trajectory, supported by strong buying interest. The Bollinger Bands indicate potential for a breakout. However, watch for resistance at $225, which could trigger profit-taking.
Analysis
AMZN's performance has been bullish, with a recent breakout above key resistance levels. The volume has been increasing, indicating strong interest. The MACD remains positive, but the RSI is nearing overbought territory, suggesting caution. Key support is at $215.
Confidence Level
Potential Risks
Resistance at $225 may lead to profit-taking. Market volatility could impact price stability.
1 Month Prediction
Target: August 1, 2025$230
$222
$235
$220
Description
Expect continued bullish momentum as the stock breaks through resistance levels. The Fibonacci retracement levels suggest a target of $230. However, watch for potential pullbacks as the market adjusts.
Analysis
AMZN has shown strong upward momentum, with key support at $220 and resistance at $230. The MACD and moving averages indicate bullish trends, but the RSI suggests potential overbought conditions. Volume patterns indicate strong buying interest, but external factors could introduce volatility.
Confidence Level
Potential Risks
Market corrections could occur, especially if external economic factors influence sentiment. Watch for volatility.
3 Months Prediction
Target: October 1, 2025$240
$230
$245
$225
Description
Long-term bullish outlook as the stock is expected to break through key resistance levels. The overall market sentiment is positive, but external economic factors could introduce volatility.
Analysis
AMZN's long-term performance shows a bullish trend, with significant support at $225 and resistance at $240. The MACD indicates positive momentum, but the RSI suggests caution as it approaches overbought levels. Volume patterns indicate strong interest, but external factors could introduce volatility.
Confidence Level
Potential Risks
Unforeseen macroeconomic events could impact the stock's performance. Watch for potential corrections.