AMZN Trading Predictions
1 Day Prediction
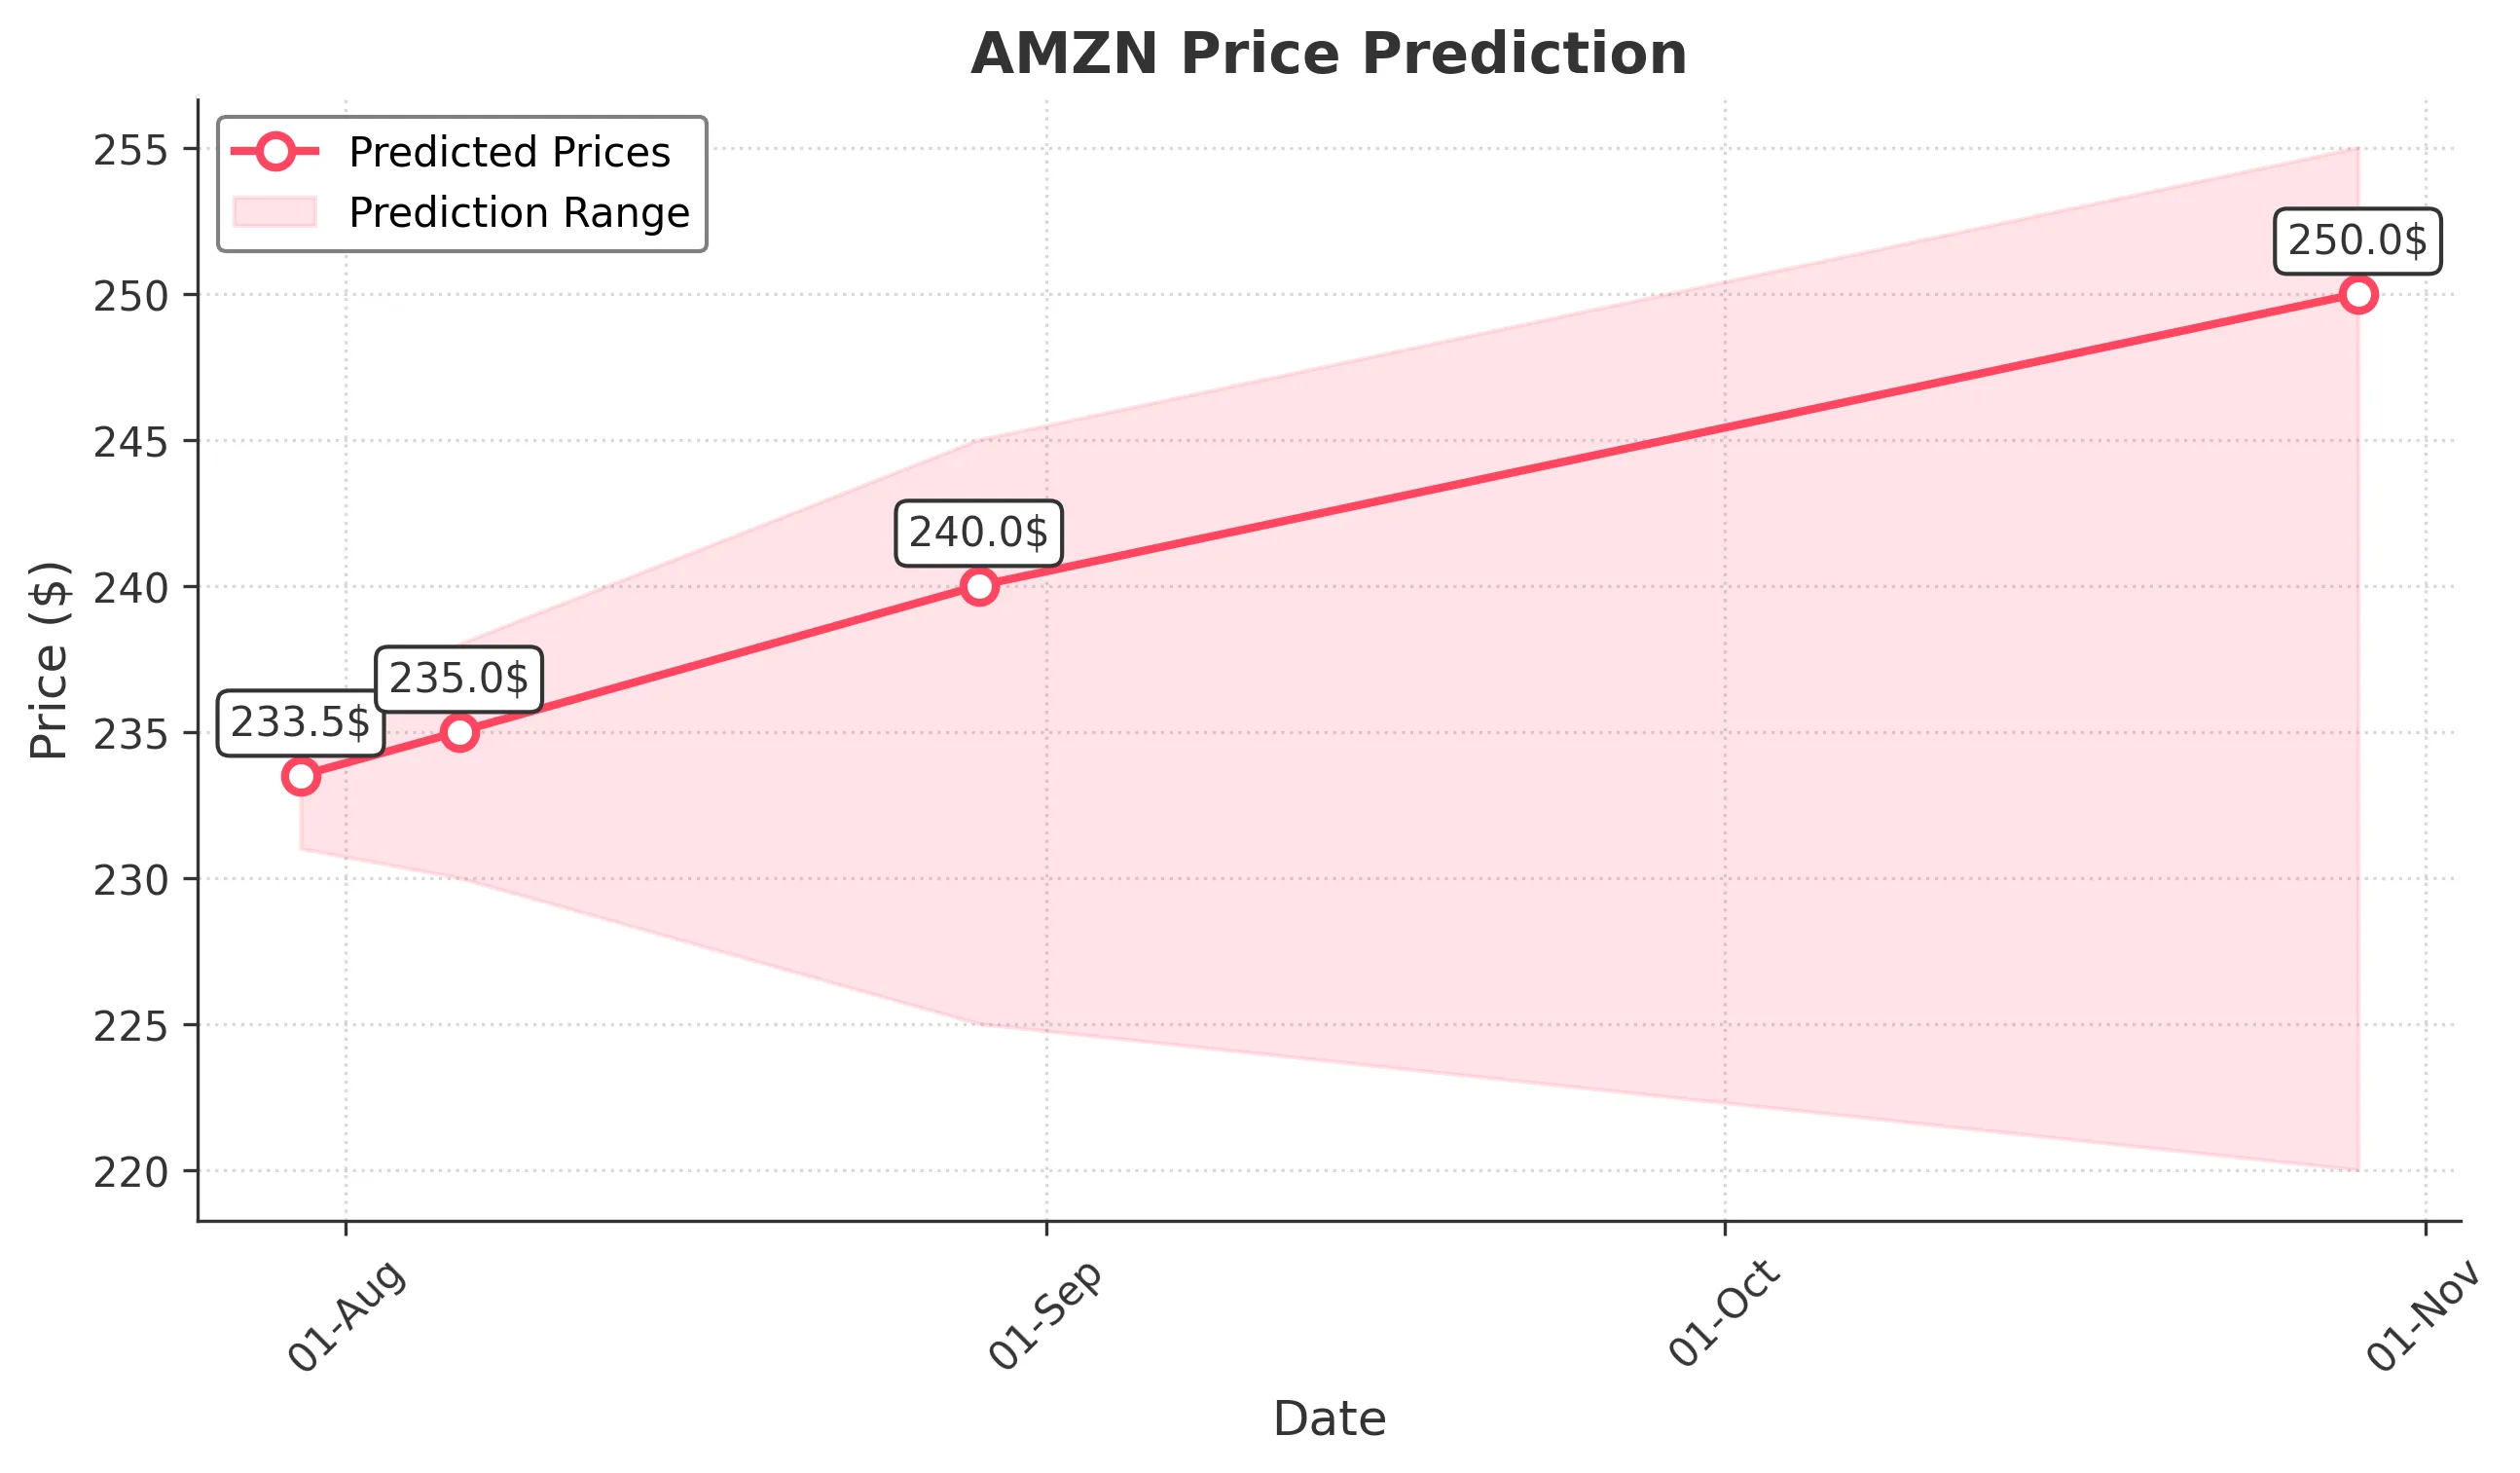
Target: July 30, 2025$233.5
$232.5
$235
$231
Description
The stock shows a slight bullish trend with a recent Doji candlestick indicating indecision. The RSI is near 60, suggesting room for upward movement. However, MACD is flattening, indicating potential resistance ahead.
Analysis
Over the past 3 months, AMZN has shown a bullish trend with significant support at $220 and resistance around $235. The recent volume spikes indicate strong buying interest, but the RSI nearing overbought levels suggests caution. The MACD is bullish but flattening, indicating potential consolidation.
Confidence Level
Potential Risks
Market volatility and external news could impact the price. A bearish reversal is possible if the price fails to break above recent highs.
1 Week Prediction
Target: August 6, 2025$235
$233.5
$238
$230
Description
The stock is expected to continue its upward momentum, supported by a bullish MACD crossover. The Bollinger Bands are widening, indicating increased volatility. However, the RSI is approaching overbought territory, suggesting caution.
Analysis
AMZN has been trending upward with strong support at $220. The recent price action shows bullish candlestick patterns, and the average volume has increased, indicating strong interest. However, the RSI nearing overbought levels could lead to a short-term pullback.
Confidence Level
Potential Risks
Potential market corrections or negative news could lead to a pullback. Watch for volume trends to confirm the bullish sentiment.
1 Month Prediction
Target: August 29, 2025$240
$235
$245
$225
Description
The stock is likely to reach new highs as bullish sentiment persists. Fibonacci retracement levels suggest strong support at $225. However, the RSI indicates potential overbought conditions, which could lead to volatility.
Analysis
AMZN has shown a strong bullish trend with significant resistance at $240. The MACD remains bullish, and the volume patterns indicate strong buying interest. However, the RSI is high, suggesting a potential pullback could occur if the momentum wanes.
Confidence Level
Potential Risks
Market sentiment can shift quickly, and any negative news could trigger a sell-off. Watch for signs of exhaustion in the rally.
3 Months Prediction
Target: October 29, 2025$250
$240
$255
$220
Description
Long-term bullish outlook as the stock is expected to break through resistance levels. The MACD indicates a strong upward trend, but the RSI suggests caution as it approaches overbought levels.
Analysis
AMZN has been on a bullish trajectory with key support at $220 and resistance at $250. The overall market sentiment is positive, but external factors such as economic data and earnings reports could introduce volatility. The stock's performance will depend on maintaining momentum and managing overbought conditions.
Confidence Level
Potential Risks
Macroeconomic factors and earnings reports could significantly impact the stock's performance. A correction is possible if the market sentiment shifts.