AMZN Trading Predictions
1 Day Prediction
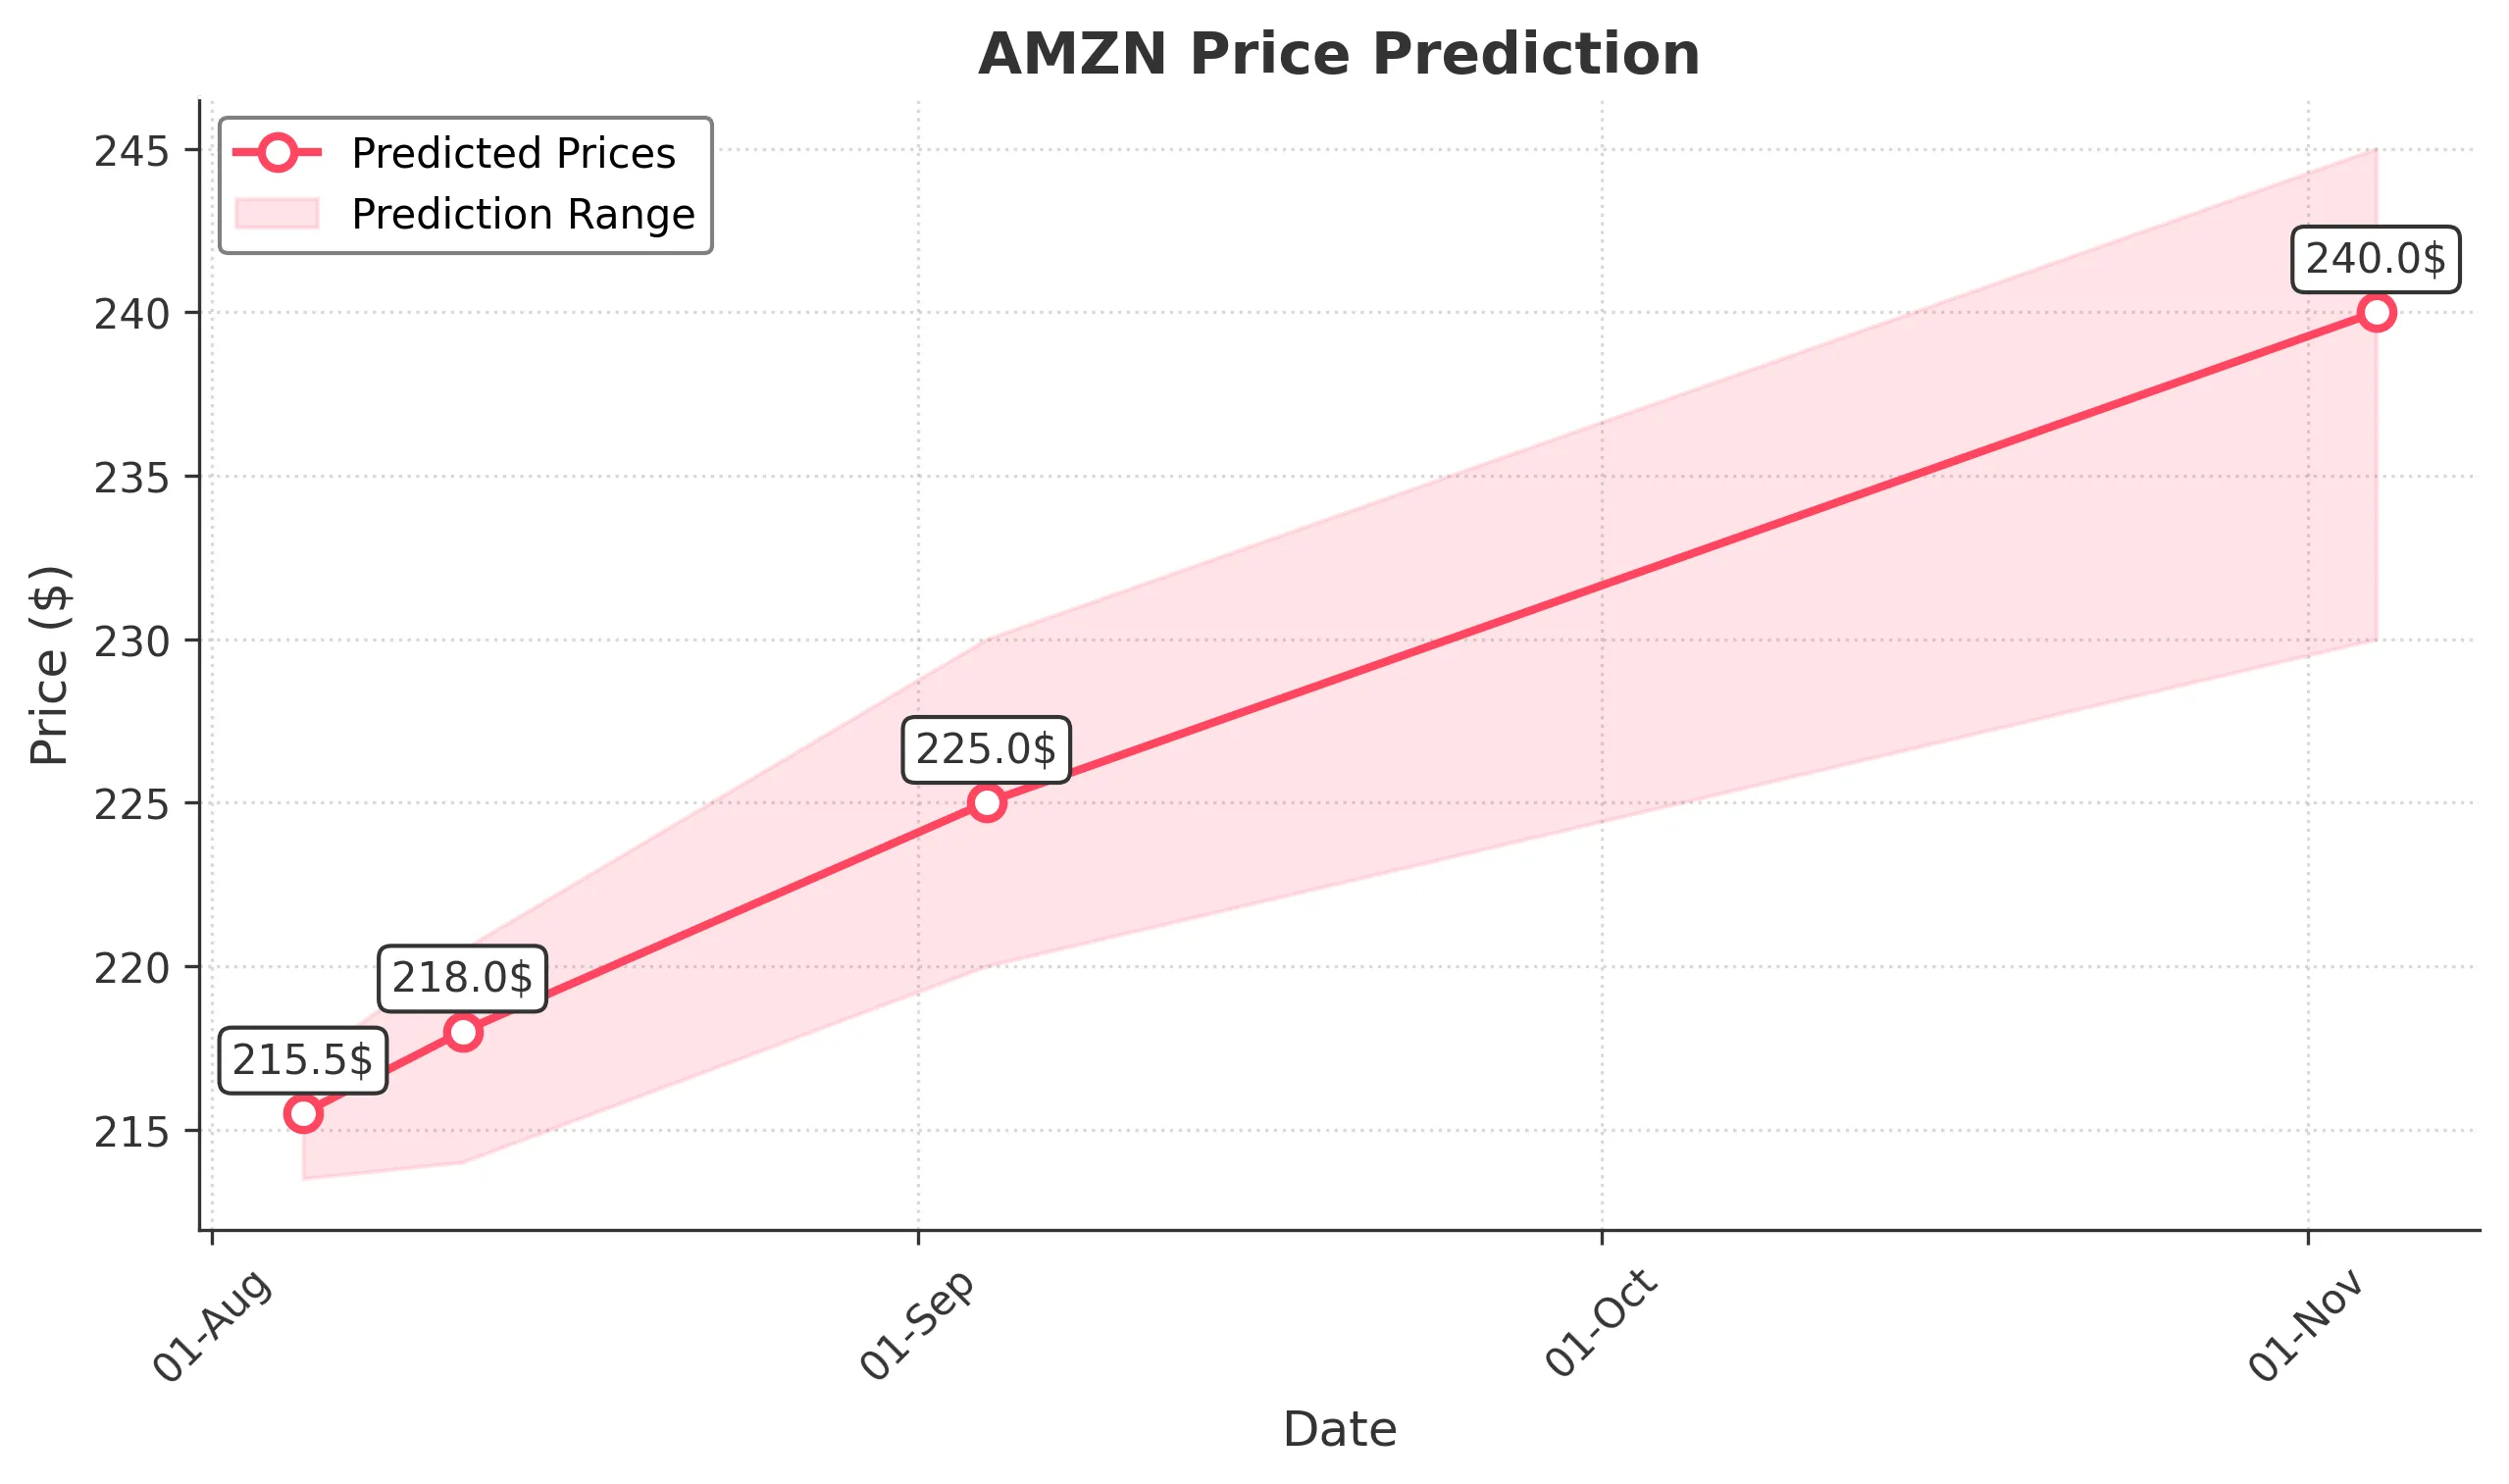
Target: August 5, 2025$215.5
$215
$217
$213.5
Description
The stock shows a slight recovery potential after a recent drop. RSI indicates oversold conditions, while MACD suggests a bullish crossover. However, the recent high volume sell-off raises caution.
Analysis
AMZN has experienced a bearish trend recently, with significant selling pressure. Key support is around $214, while resistance is at $220. The RSI is approaching oversold levels, indicating potential for a bounce.
Confidence Level
Potential Risks
Market sentiment remains volatile, and external news could impact the stock's performance.
1 Week Prediction
Target: August 12, 2025$218
$216.5
$220.5
$214
Description
A potential rebound is expected as the stock approaches key support levels. The MACD shows signs of bullish momentum, and the RSI is recovering. However, market volatility remains a concern.
Analysis
The stock has been in a bearish phase, but recent price action suggests a possible reversal. Support at $214 is critical, while resistance at $220 could limit upside. Volume patterns indicate cautious optimism.
Confidence Level
Potential Risks
Unforeseen macroeconomic events could disrupt the recovery, leading to further declines.
1 Month Prediction
Target: September 4, 2025$225
$222
$230
$220
Description
If the bullish momentum continues, AMZN could reach $225. The RSI is stabilizing, and MACD indicates a potential upward trend. However, external factors could still pose risks.
Analysis
AMZN's performance has been mixed, with recent bearish trends. Key support at $214 and resistance at $230 are crucial. The stock's volatility is high, and external factors could influence future movements.
Confidence Level
Potential Risks
Market sentiment could shift due to economic data releases or earnings reports.
3 Months Prediction
Target: November 4, 2025$240
$235
$245
$230
Description
Long-term bullish sentiment may prevail if the stock breaks above $230. The MACD and RSI suggest a positive trend, but macroeconomic uncertainties could impact performance.
Analysis
Over the past three months, AMZN has shown volatility with a bearish trend recently. Key support at $214 and resistance at $245 are critical. The stock's future performance will depend on broader market conditions and sentiment.
Confidence Level
Potential Risks
Potential economic downturns or changes in market sentiment could lead to price corrections.