AMZN Trading Predictions
1 Day Prediction
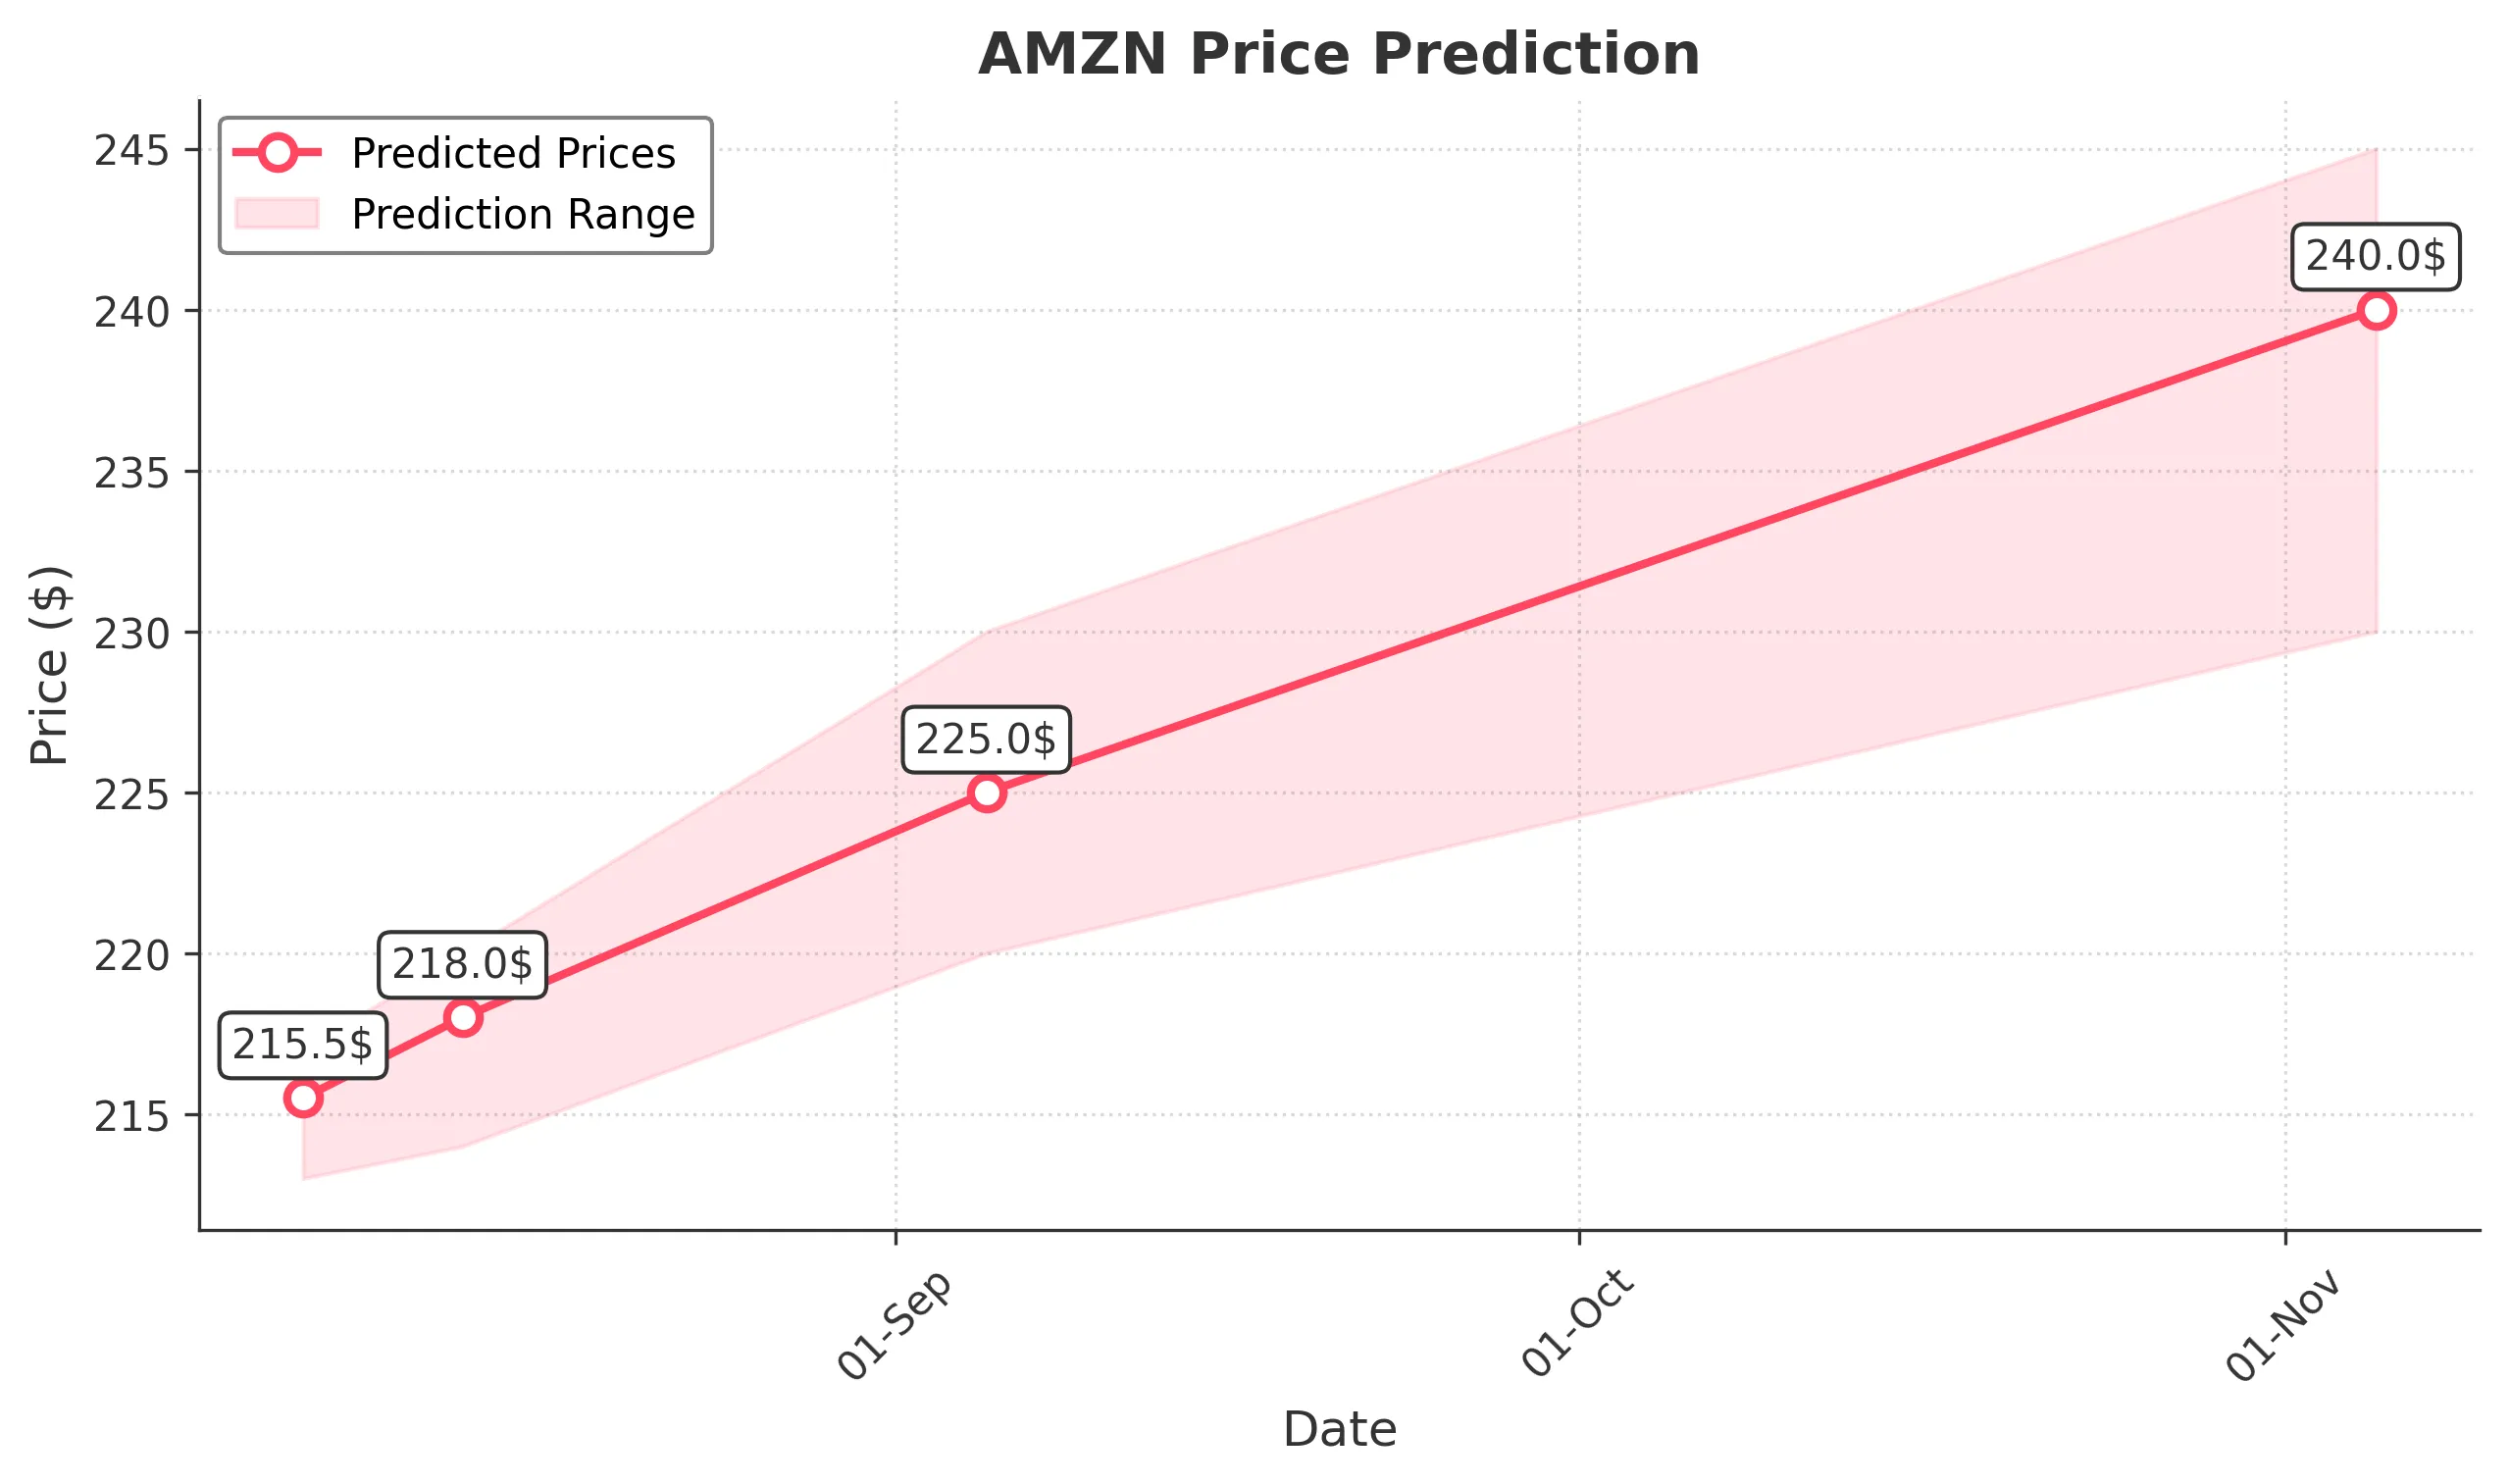
Target: August 6, 2025$215.5
$215
$217
$213
Description
The stock shows a slight bullish trend with a recent Doji candlestick indicating indecision. RSI is neutral, and MACD is close to crossing above the signal line, suggesting potential upward momentum. However, recent high volatility may lead to price fluctuations.
Analysis
Over the past 3 months, AMZN has shown a bullish trend with significant price increases, reaching a peak of 232.23. Key support is around 210, while resistance is near 236. Volume spikes indicate strong interest, but recent volatility raises concerns about potential pullbacks.
Confidence Level
Potential Risks
Market sentiment is mixed, and external factors like earnings reports could impact the price significantly.
1 Week Prediction
Target: August 13, 2025$218
$216.5
$220
$214
Description
The stock is expected to maintain a bullish trend with support from recent upward momentum. The MACD indicates a potential bullish crossover, while the RSI remains stable. However, the market's reaction to macroeconomic news could introduce volatility.
Analysis
AMZN has experienced a strong upward trend, with significant volume supporting price increases. The recent price action suggests bullish sentiment, but resistance levels around 220 may pose challenges. Technical indicators support continued upward movement, but caution is warranted.
Confidence Level
Potential Risks
Potential market corrections or negative news could impact the stock's performance.
1 Month Prediction
Target: September 5, 2025$225
$222
$230
$220
Description
The stock is likely to continue its upward trajectory, supported by strong fundamentals and positive market sentiment. The Bollinger Bands indicate potential for price expansion, while the RSI suggests room for growth. However, external economic factors could introduce risk.
Analysis
AMZN's performance has been characterized by strong bullish momentum, with key support at 210 and resistance at 236. Technical indicators suggest continued upward movement, but the potential for market corrections remains a concern. Volume patterns indicate strong investor interest.
Confidence Level
Potential Risks
Economic data releases or geopolitical events could lead to unexpected volatility.
3 Months Prediction
Target: November 5, 2025$240
$235
$245
$230
Description
Long-term bullish sentiment is supported by strong earnings potential and market trends. The Fibonacci retracement levels suggest a target around 240, with the MACD indicating sustained upward momentum. However, macroeconomic uncertainties could pose risks.
Analysis
AMZN has shown a robust upward trend over the past three months, with significant price increases and strong volume. Key support levels are around 210, while resistance is at 236. The overall market sentiment remains positive, but external factors could introduce volatility.
Confidence Level
Potential Risks
Unforeseen economic downturns or changes in consumer behavior could negatively impact the stock's performance.