AMZN Trading Predictions
1 Day Prediction
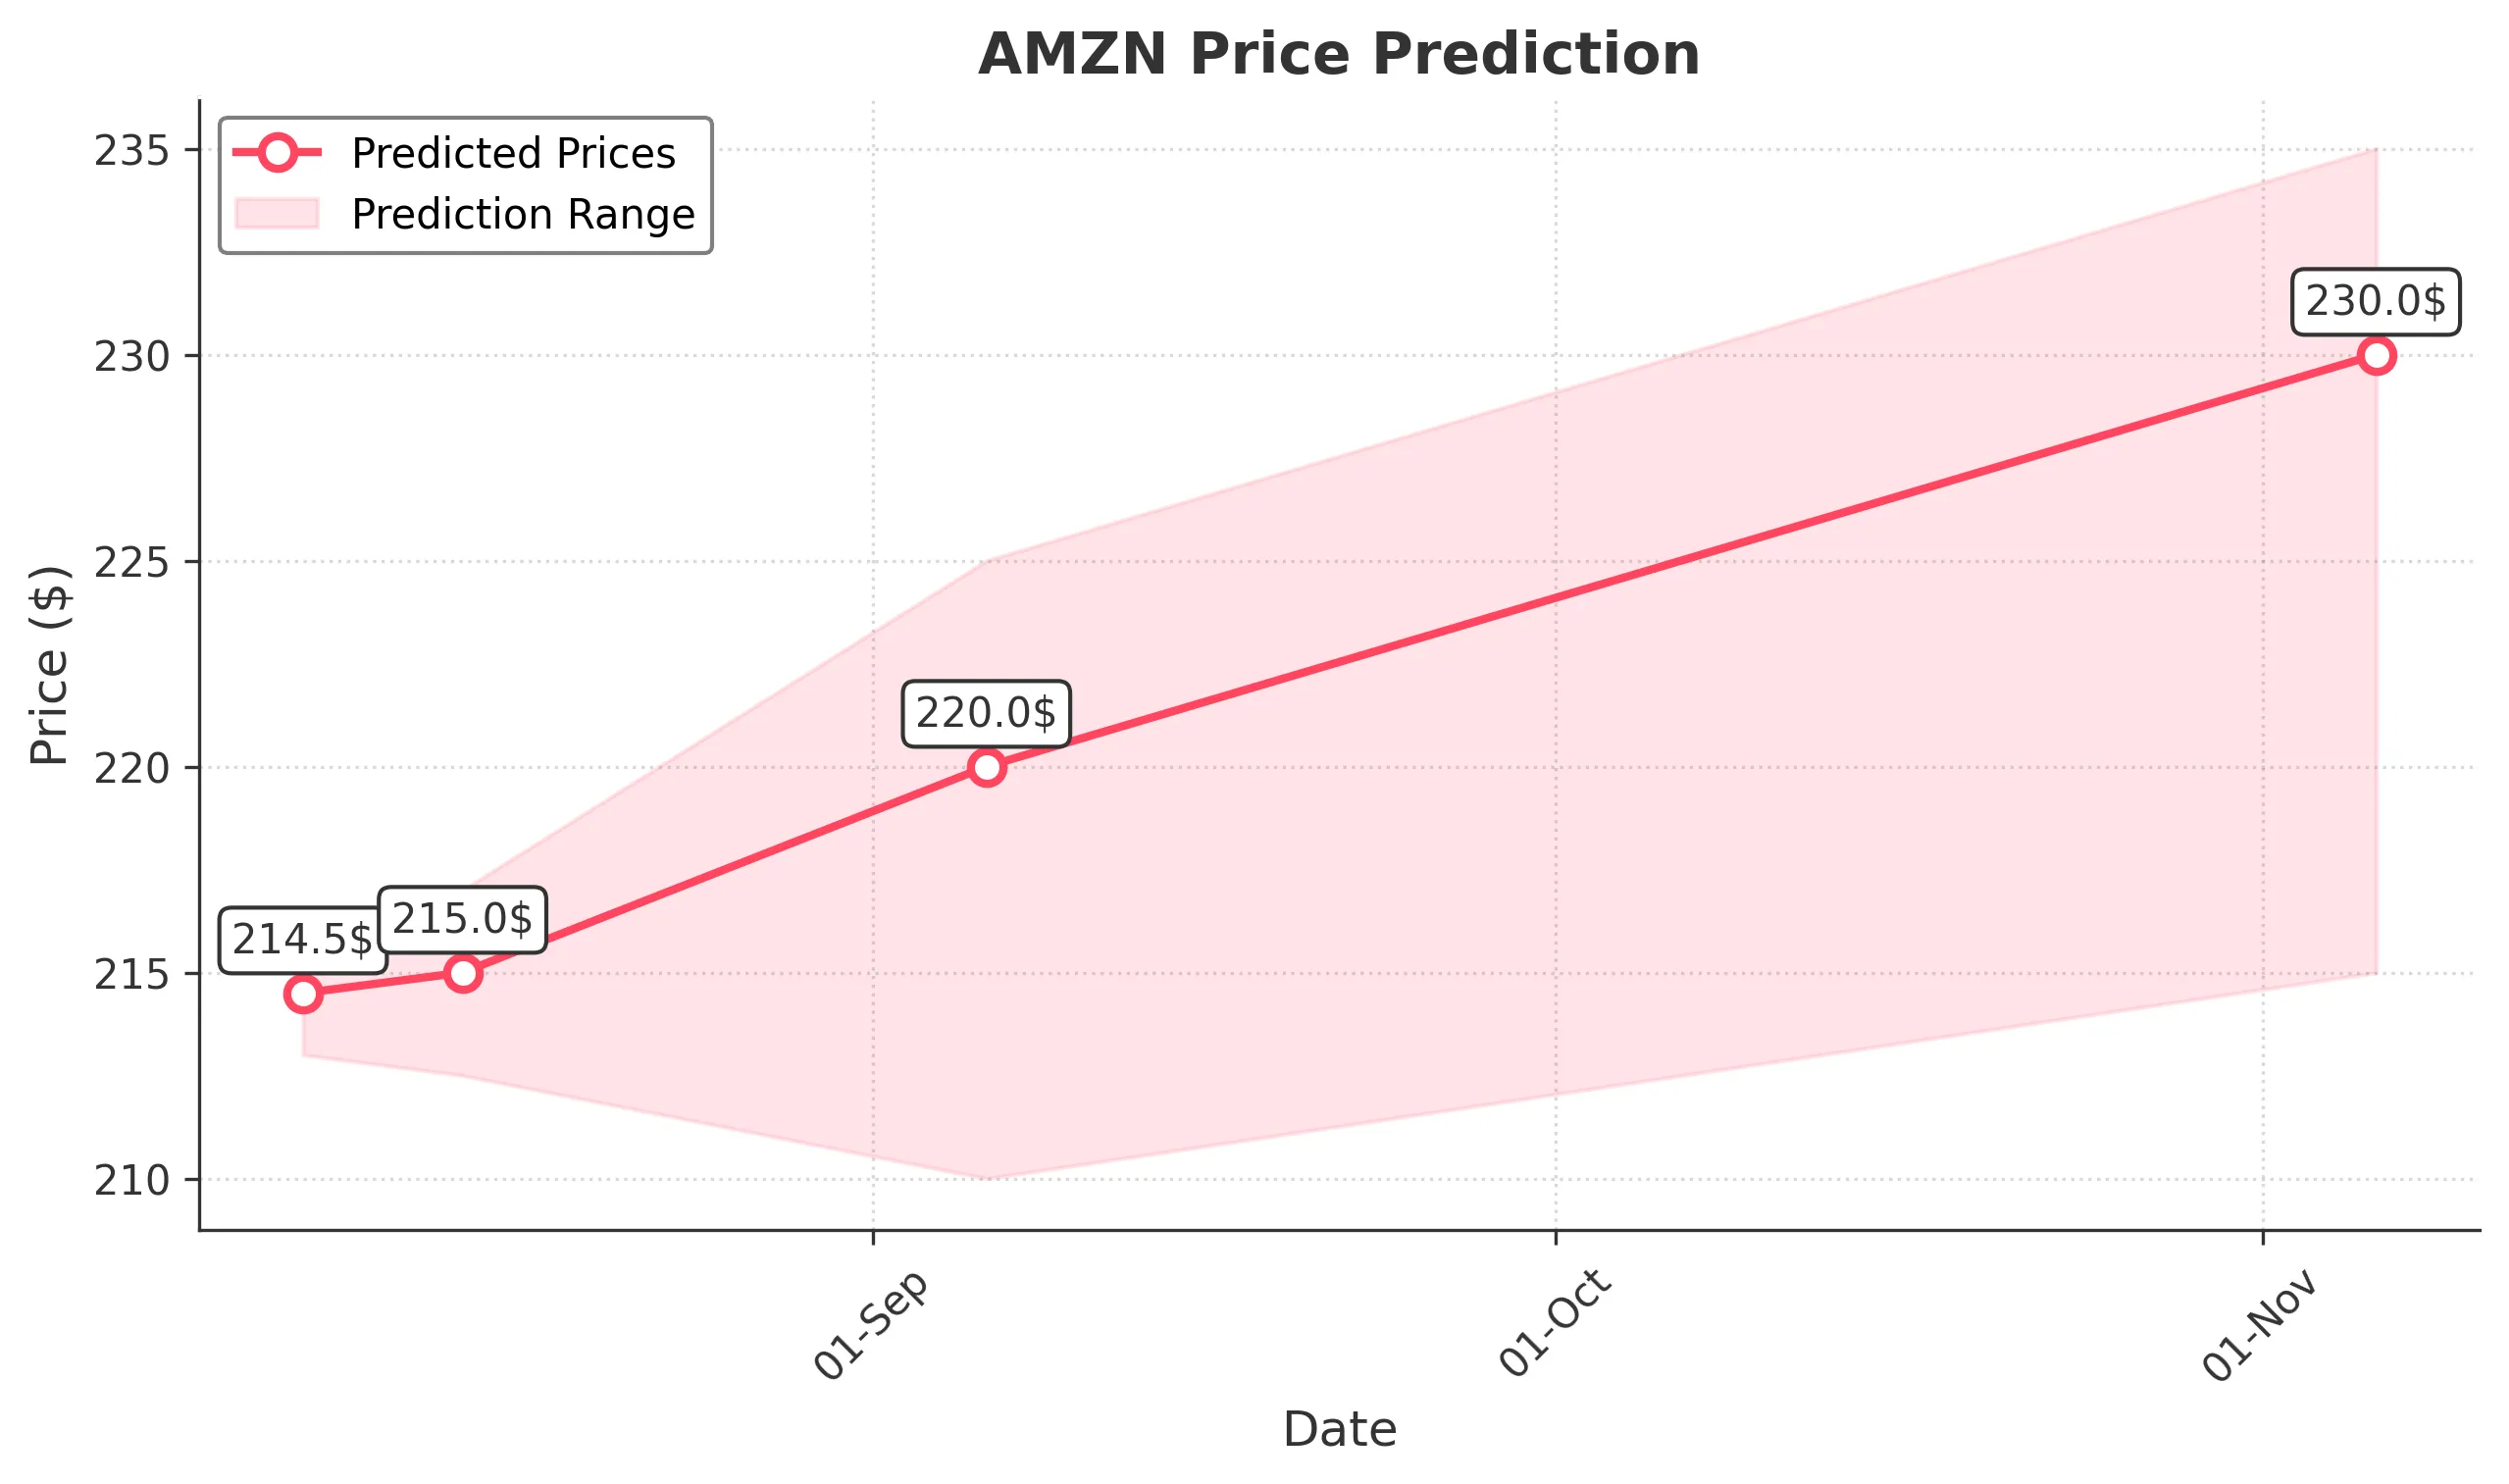
Target: August 7, 2025$214.5
$214
$215.5
$213
Description
The stock shows a slight bullish trend with a potential close around 214.50. The RSI is neutral, and MACD indicates a potential upward momentum. However, recent volatility suggests caution.
Analysis
AMZN has shown a bearish trend recently, with significant volume spikes indicating selling pressure. Key support is around 210, while resistance is near 220. The RSI is neutral, suggesting indecision in the market.
Confidence Level
Potential Risks
Market sentiment could shift due to external news or earnings reports, impacting the prediction.
1 Week Prediction
Target: August 14, 2025$215
$214.5
$217
$212.5
Description
Expect a close around 215.00 as the stock may stabilize after recent fluctuations. The Bollinger Bands indicate potential consolidation, but external factors could influence volatility.
Analysis
The stock has been volatile, with recent highs and lows indicating a struggle for direction. Support at 210 and resistance at 220 remain critical. Volume analysis shows increased selling pressure.
Confidence Level
Potential Risks
Potential for market corrections or news events could lead to unexpected price movements.
1 Month Prediction
Target: September 6, 2025$220
$215
$225
$210
Description
A potential recovery to 220.00 is expected as the stock may find support at lower levels. The MACD shows signs of bullish divergence, indicating a possible upward trend.
Analysis
AMZN has been in a bearish phase but shows signs of recovery. Key support at 210 and resistance at 225. The RSI indicates potential for upward movement, but market sentiment remains cautious.
Confidence Level
Potential Risks
Economic indicators and earnings reports could impact the stock's performance significantly.
3 Months Prediction
Target: November 6, 2025$230
$220
$235
$215
Description
A gradual increase to 230.00 is anticipated as the stock stabilizes. The Fibonacci retracement levels suggest a potential upward trend, but macroeconomic factors could introduce volatility.
Analysis
Over the past three months, AMZN has experienced significant volatility with a bearish trend recently. Key support at 210 and resistance at 225. The MACD and RSI suggest potential for recovery, but caution is warranted.
Confidence Level
Potential Risks
Unforeseen economic events or changes in market sentiment could lead to price fluctuations.