AMZN Trading Predictions
1 Day Prediction
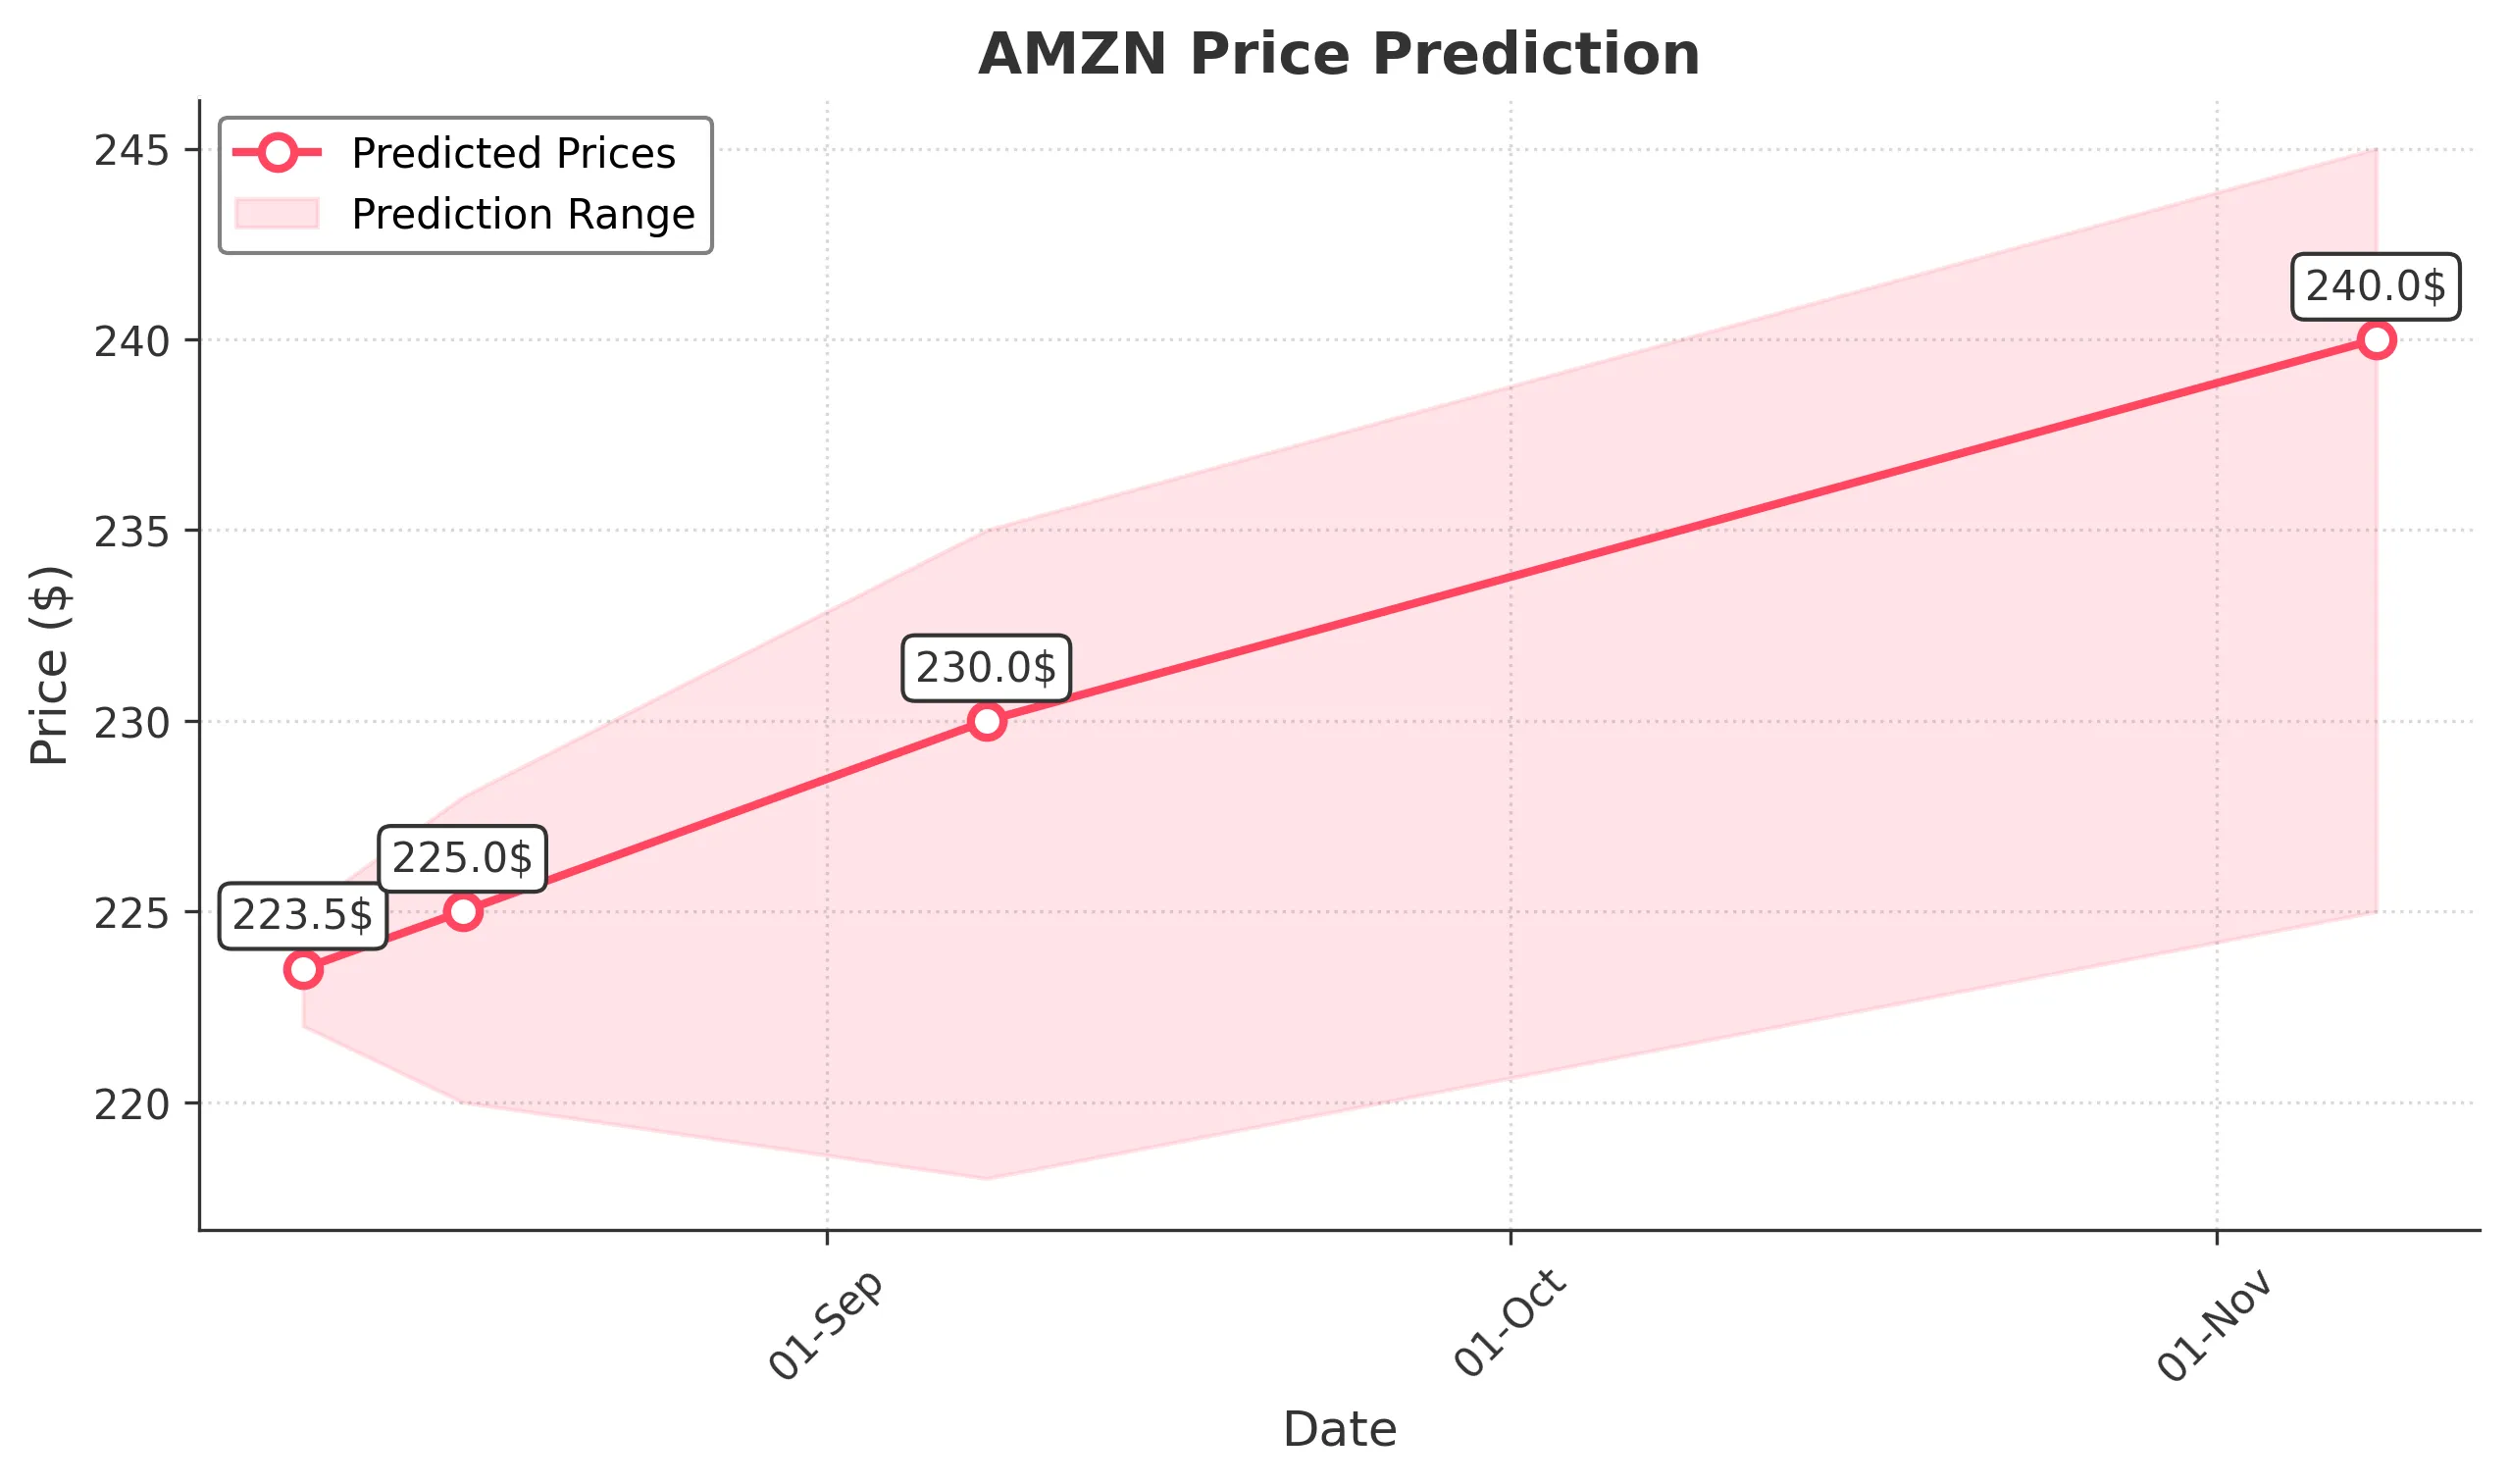
Target: August 9, 2025$223.5
$223.2
$225
$222
Description
The stock shows a slight bullish trend with a recent Doji candlestick indicating indecision. RSI is neutral, and MACD is close to crossing above the signal line, suggesting potential upward momentum. Volume is expected to be moderate.
Analysis
AMZN has shown volatility with a recent drop followed by a recovery. Key support at 220.00 and resistance at 225.00. The RSI indicates a neutral position, while MACD suggests potential bullish momentum. Volume spikes on recent trading days indicate increased interest.
Confidence Level
Potential Risks
Market sentiment could shift due to external news or earnings reports, which may impact the prediction.
1 Week Prediction
Target: August 16, 2025$225
$223.5
$228
$220
Description
The stock is expected to trend upward as it approaches resistance levels. The MACD is showing bullish divergence, and the RSI is moving towards overbought territory. Volume is likely to increase as traders react to market sentiment.
Analysis
Over the past week, AMZN has shown a recovery from recent lows, with key support at 220.00. The stock is currently in a bullish phase, with increasing volume and positive MACD signals. However, external factors could introduce volatility.
Confidence Level
Potential Risks
Potential market corrections or negative news could reverse the trend, impacting the accuracy of this prediction.
1 Month Prediction
Target: September 8, 2025$230
$225
$235
$218
Description
The stock is expected to continue its upward trajectory, supported by bullish technical indicators. The Fibonacci retracement levels suggest a target around 230.00, with potential resistance at 235.00. Volume trends indicate sustained interest.
Analysis
AMZN has been in a bullish trend, with significant support at 220.00 and resistance at 235.00. The RSI is approaching overbought levels, and MACD indicates bullish momentum. Volume patterns suggest strong interest, but external factors could introduce risk.
Confidence Level
Potential Risks
Market volatility and economic indicators could affect the stock's performance, leading to potential corrections.
3 Months Prediction
Target: November 8, 2025$240
$230
$245
$225
Description
Long-term bullish sentiment is expected as the stock approaches key resistance levels. The MACD indicates a strong upward trend, and the RSI suggests continued buying interest. Volume is likely to remain high as traders react to earnings reports.
Analysis
AMZN's performance over the past three months shows a bullish trend with key support at 220.00 and resistance at 245.00. The stock has experienced significant volume spikes, indicating strong market interest. However, macroeconomic factors could introduce uncertainty.
Confidence Level
Potential Risks
Economic conditions and market sentiment could shift, leading to potential corrections or increased volatility.