AMZN Trading Predictions
1 Day Prediction
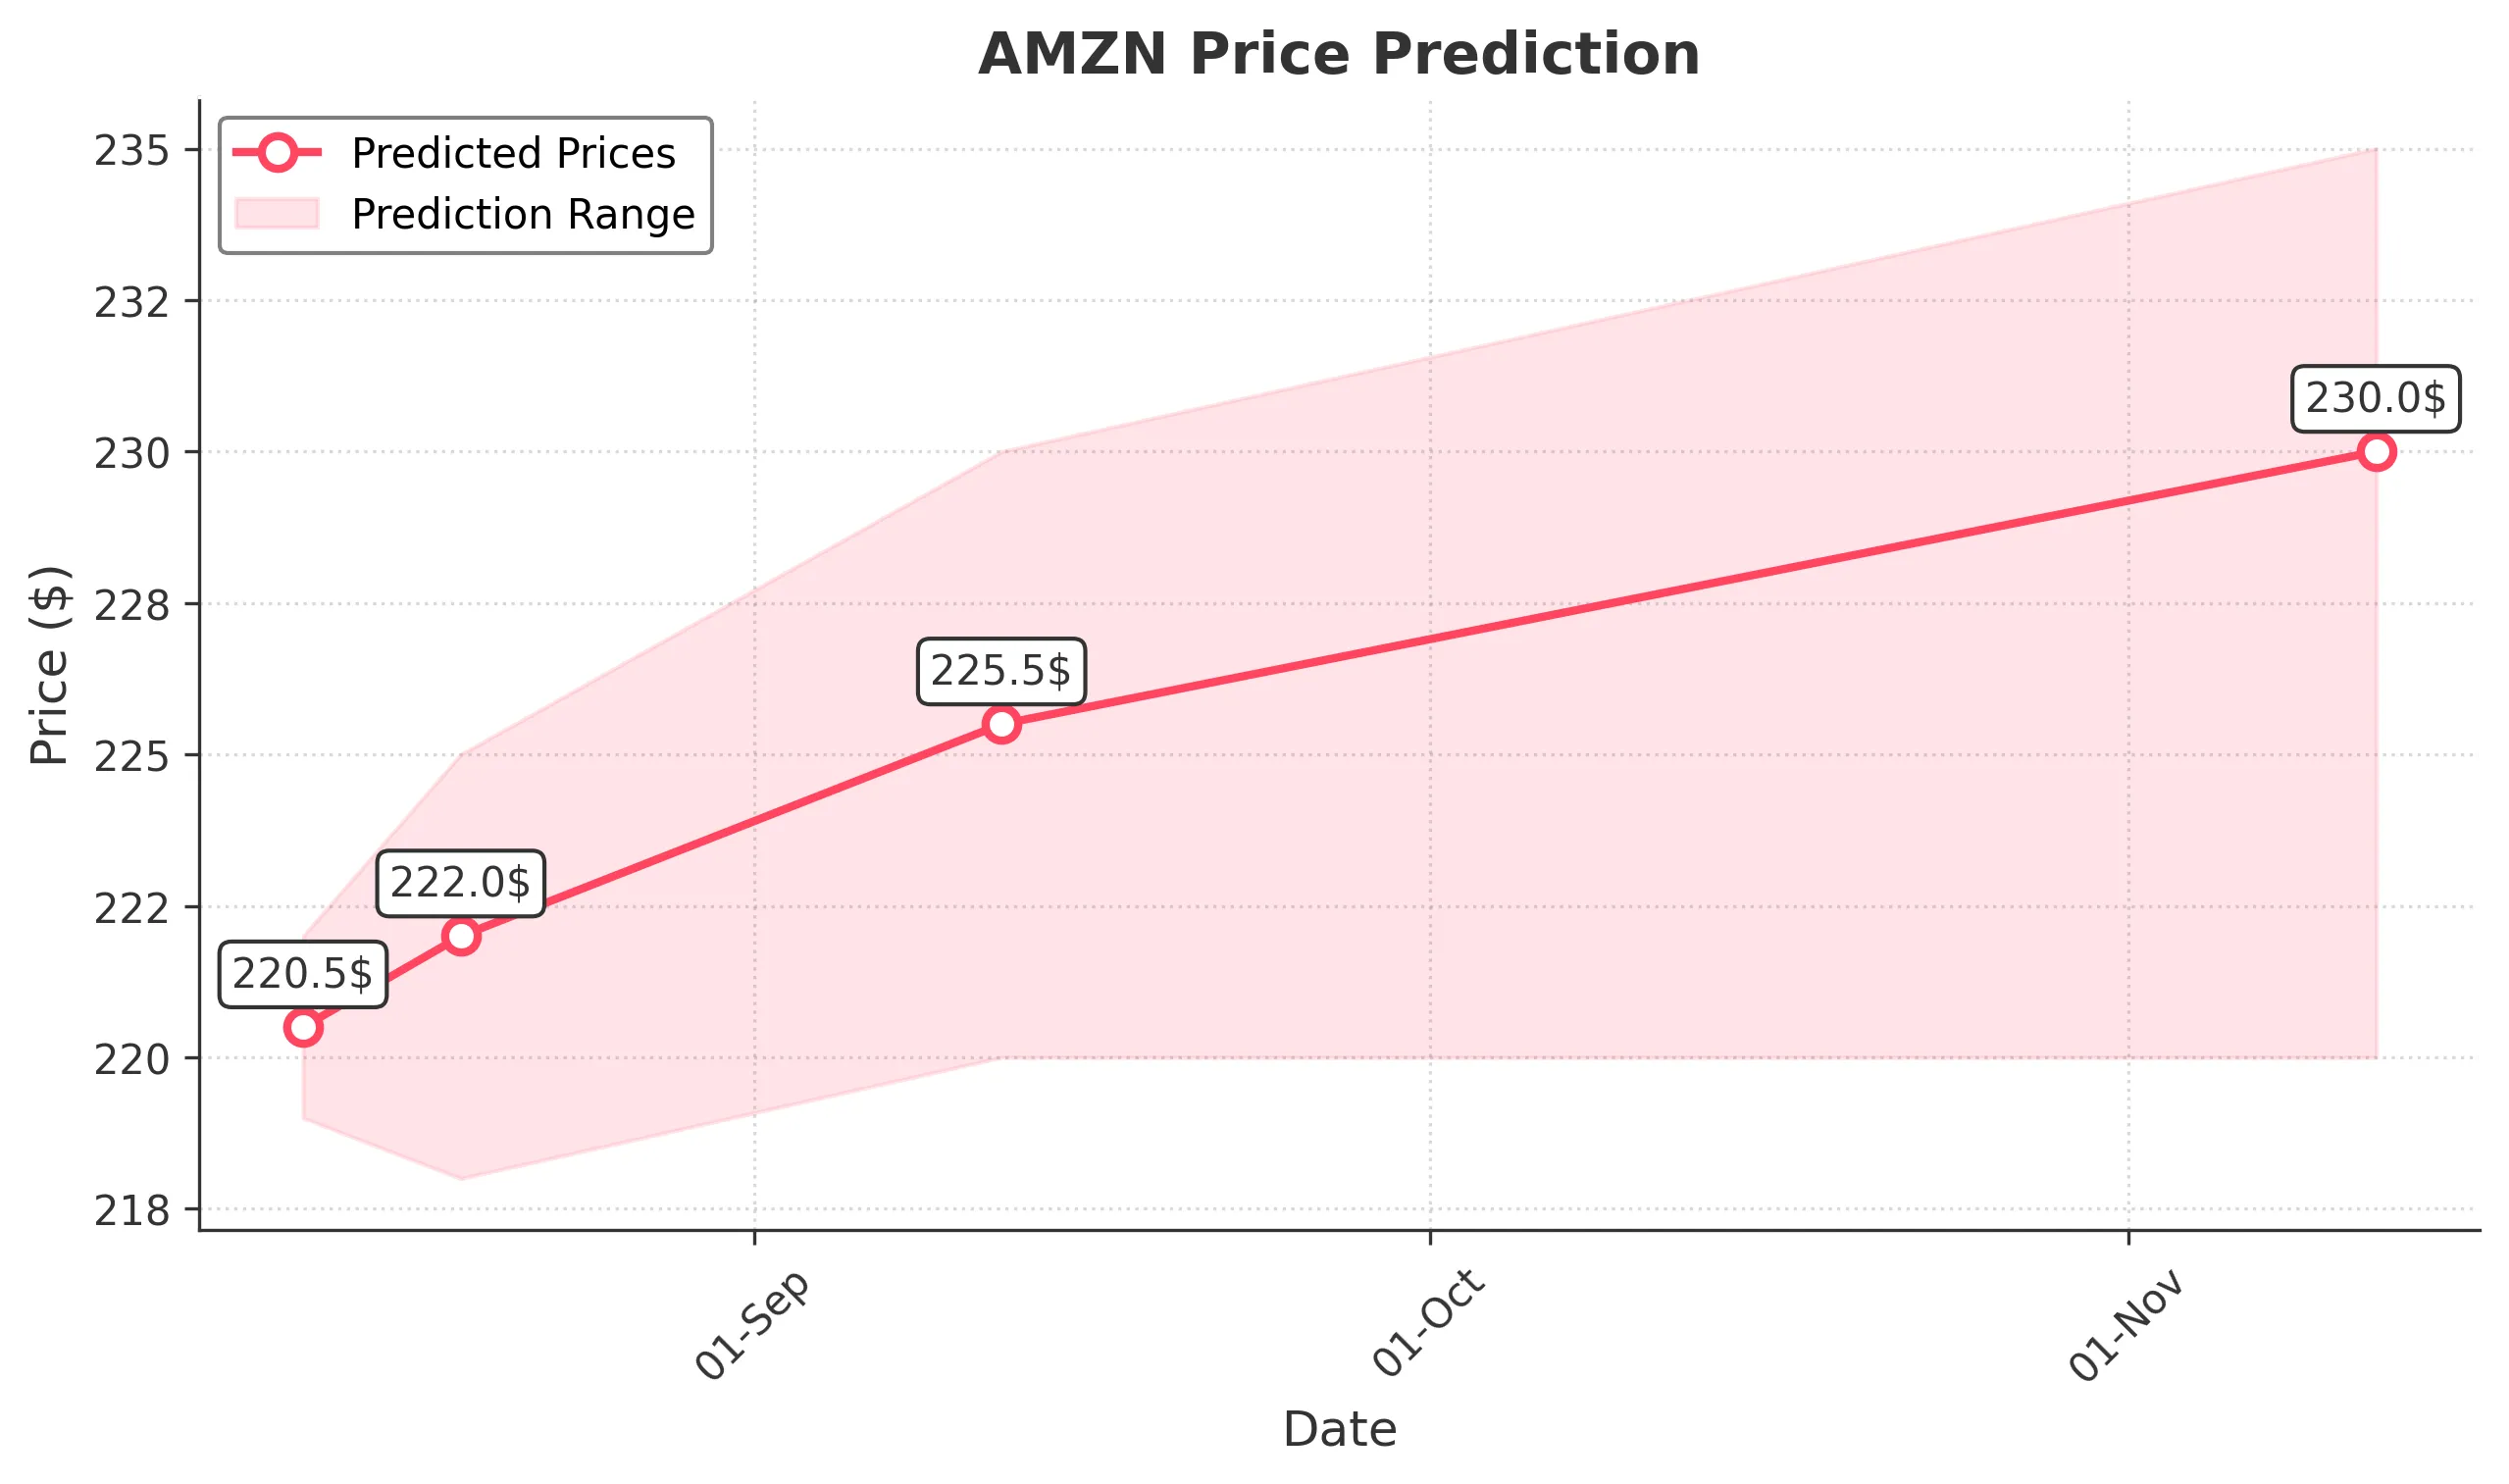
Target: August 12, 2025$220.5
$220
$222
$219
Description
The stock shows a slight bullish trend with a recent Doji pattern indicating indecision. RSI is neutral, and MACD is close to crossing above the signal line, suggesting potential upward momentum. However, recent volatility may lead to fluctuations.
Analysis
Over the past 3 months, AMZN has shown a bullish trend with significant support at $210 and resistance around $230. The recent price action indicates a consolidation phase, with volume spikes suggesting increased interest. Technical indicators like the MACD and RSI are mixed, indicating potential for both upward and downward movements.
Confidence Level
Potential Risks
Market sentiment could shift due to external news or earnings reports, which may impact the prediction.
1 Week Prediction
Target: August 19, 2025$222
$220.5
$225
$218
Description
The stock is expected to continue its upward trajectory, supported by a bullish engulfing pattern. The MACD is showing positive momentum, and the RSI is approaching overbought territory, indicating strong buying interest. However, caution is advised as the market may react to macroeconomic factors.
Analysis
AMZN has experienced a bullish trend with key support at $210 and resistance at $230. The recent price action shows a strong recovery from previous lows, with increasing volume indicating renewed investor interest. Technical indicators suggest a continuation of the upward trend, but external factors could introduce volatility.
Confidence Level
Potential Risks
Potential market corrections or negative news could reverse the trend, impacting the accuracy of this prediction.
1 Month Prediction
Target: September 12, 2025$225.5
$222
$230
$220
Description
The stock is likely to maintain its bullish momentum, supported by strong fundamentals and positive market sentiment. The Fibonacci retracement levels suggest a target around $225. The RSI indicates potential overbought conditions, which may lead to short-term corrections.
Analysis
In the last three months, AMZN has shown a strong recovery with significant support at $210 and resistance at $230. The stock's performance has been bolstered by positive earnings and market sentiment. Technical indicators suggest a continuation of the bullish trend, but caution is warranted due to potential market corrections.
Confidence Level
Potential Risks
Market volatility and potential earnings reports could lead to unexpected price movements, affecting the prediction.
3 Months Prediction
Target: November 12, 2025$230
$225.5
$235
$220
Description
The stock is expected to reach new highs as it breaks through resistance levels. The MACD indicates strong bullish momentum, and the RSI suggests sustained buying interest. However, external economic factors could introduce volatility.
Analysis
AMZN has shown a strong bullish trend over the past three months, with key support at $210 and resistance at $230. The stock's performance has been driven by positive earnings and market sentiment. Technical indicators suggest potential for further gains, but external factors could introduce volatility and risk.
Confidence Level
Potential Risks
Unforeseen macroeconomic events or changes in market sentiment could impact the stock's performance, leading to potential corrections.