AMZN Trading Predictions
1 Day Prediction
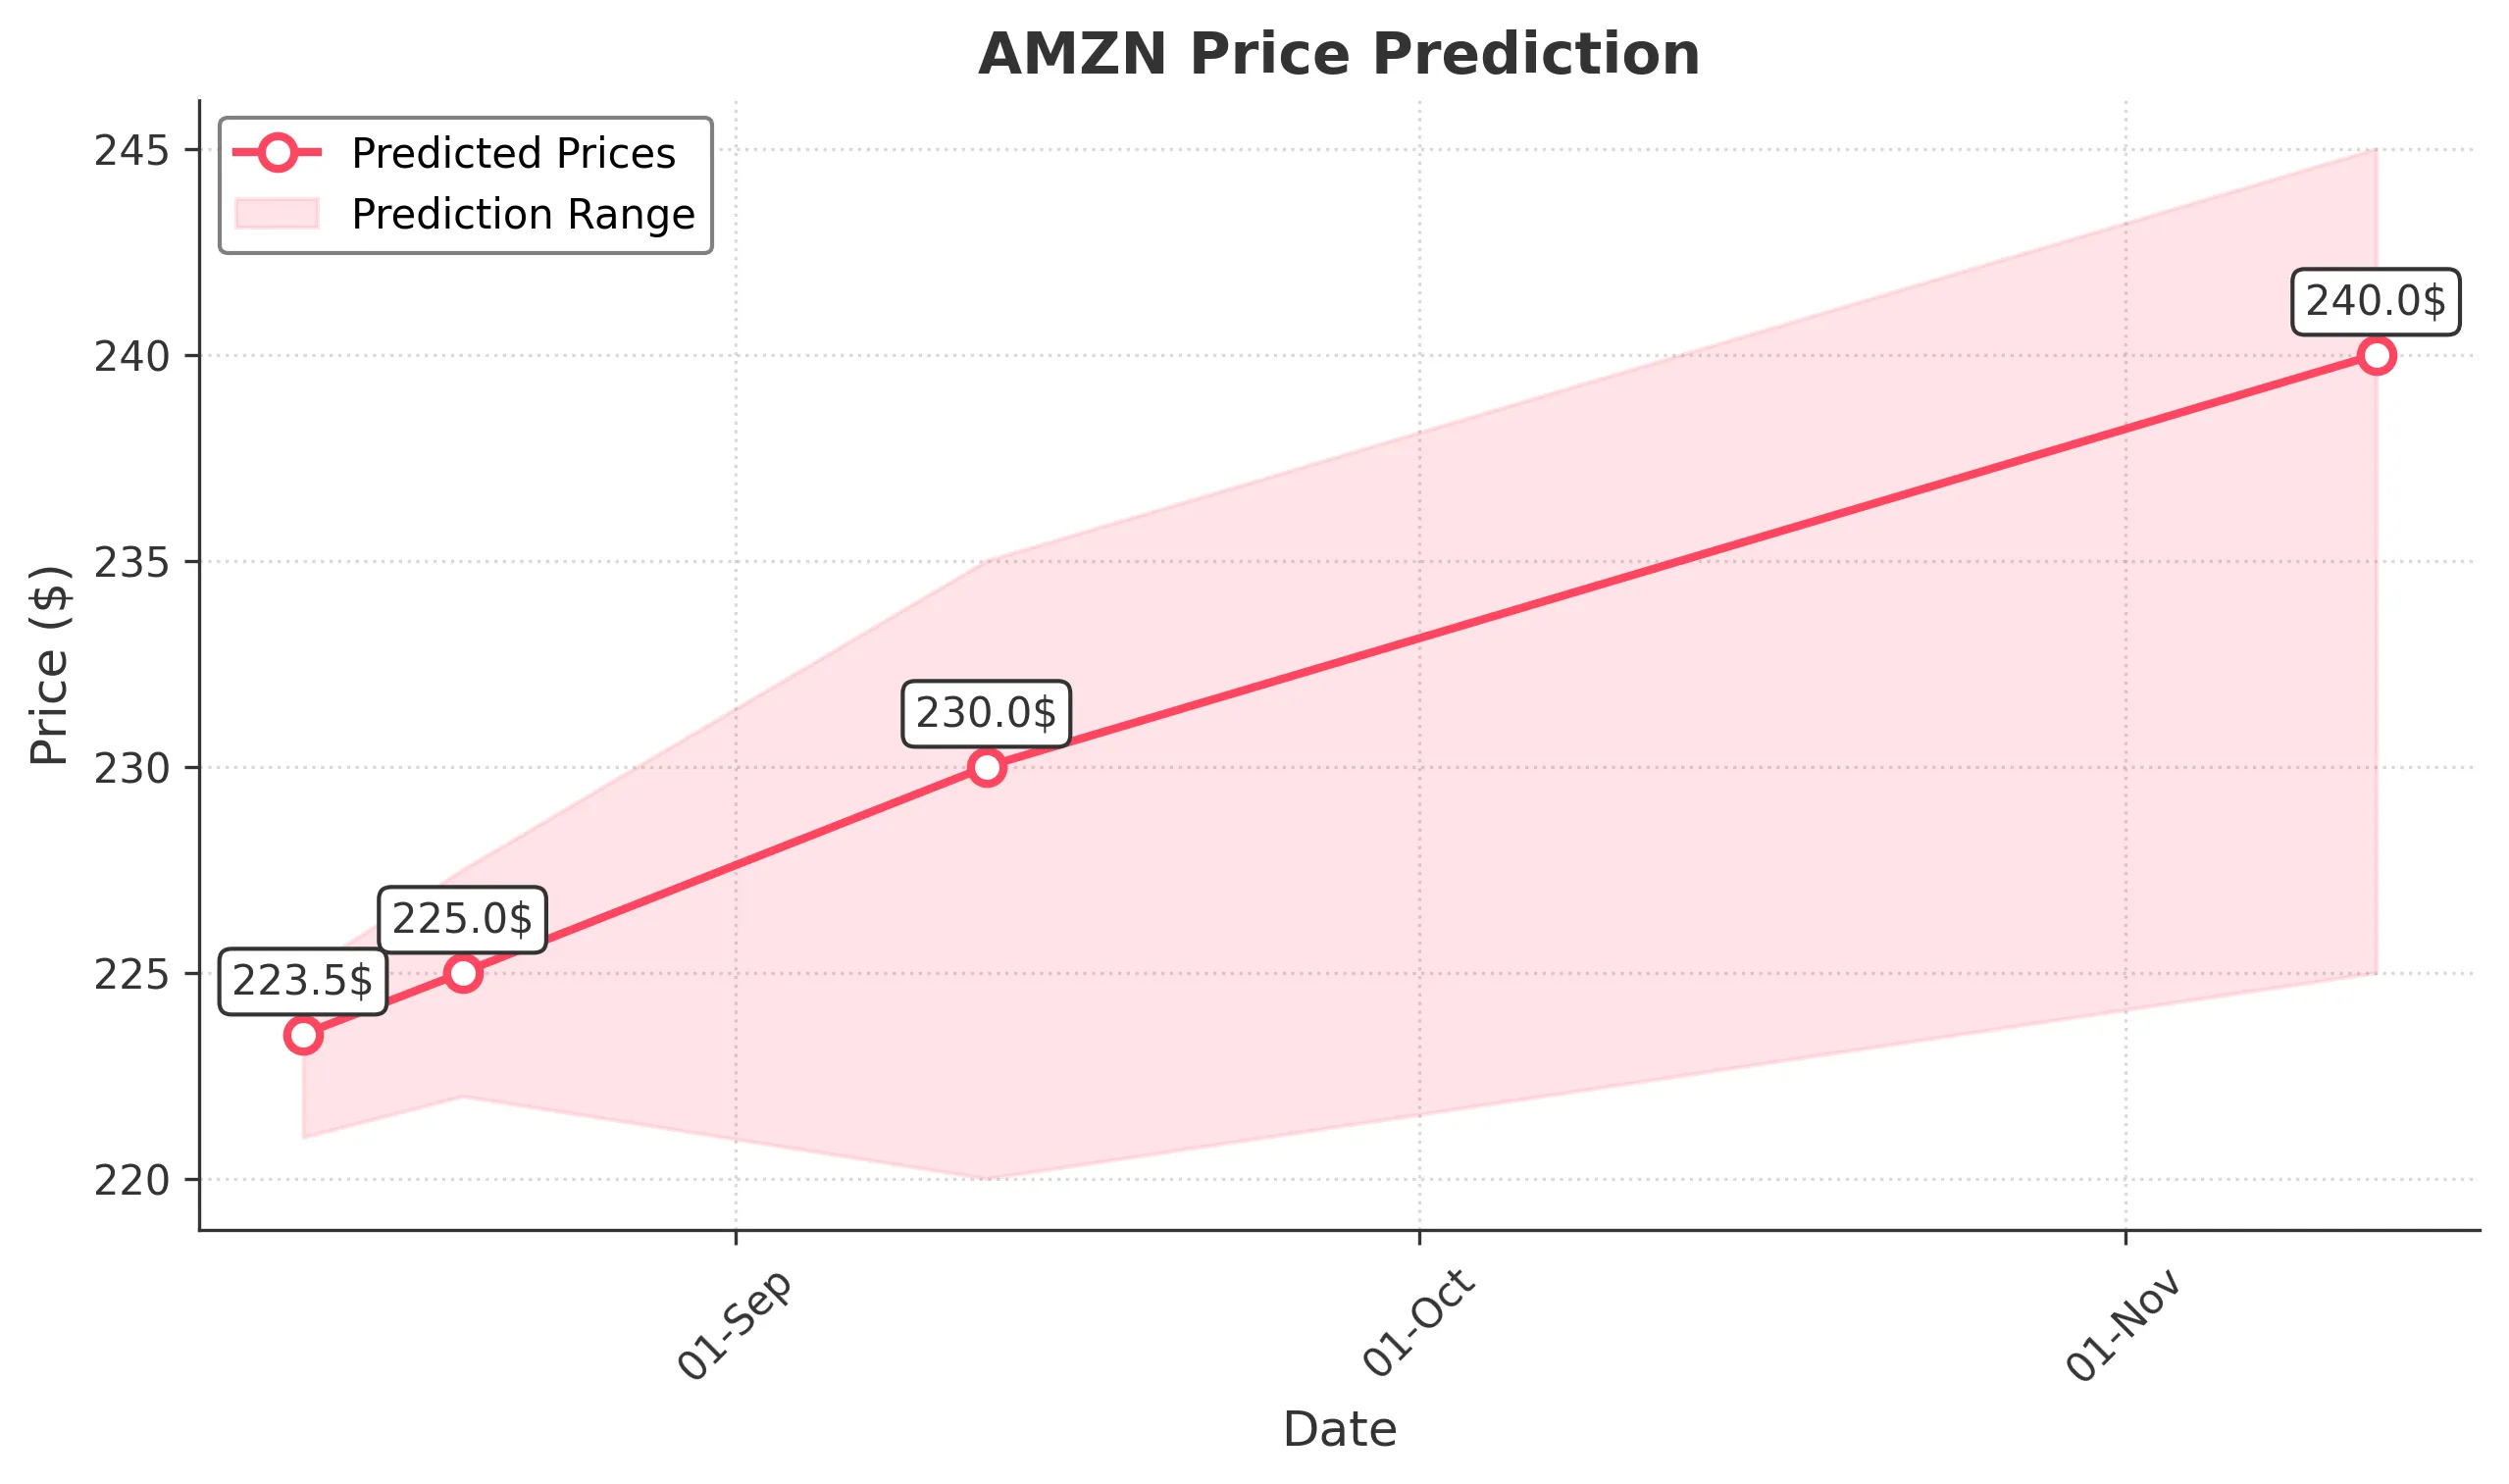
Target: August 13, 2025$223.5
$222.5
$225
$221
Description
The stock shows a bullish trend with a recent upward movement. The RSI is approaching overbought levels, indicating potential for a pullback. However, the MACD is positive, suggesting continued momentum. Volume remains steady, supporting the price action.
Analysis
Over the past 3 months, AMZN has shown a bullish trend with significant support around $210 and resistance near $230. The recent price action indicates a recovery from a dip, with the MACD and moving averages supporting upward momentum. Volume spikes on certain days suggest strong buying interest.
Confidence Level
Potential Risks
Potential market volatility and external news could impact the price unexpectedly.
1 Week Prediction
Target: August 20, 2025$225
$224
$227.5
$222
Description
The stock is expected to maintain its upward trajectory, supported by bullish candlestick patterns and positive market sentiment. The Bollinger Bands indicate potential for a breakout, but caution is advised as the RSI nears overbought territory.
Analysis
AMZN has been trending upward, with key support at $220 and resistance at $230. The recent bullish candlestick patterns suggest continued buying interest. However, the RSI indicates potential overbought conditions, which could lead to short-term corrections.
Confidence Level
Potential Risks
Market corrections or negative news could lead to a reversal in momentum.
1 Month Prediction
Target: September 12, 2025$230
$225.5
$235
$220
Description
The stock is likely to continue its upward trend, driven by strong earnings reports and positive market sentiment. The Fibonacci retracement levels suggest a target around $230, but caution is warranted as the market may face volatility.
Analysis
AMZN's performance has been strong, with a bullish trend supported by positive earnings expectations. Key resistance levels are around $230, while support is at $220. The stock's volatility is moderate, and external economic factors could influence future price movements.
Confidence Level
Potential Risks
Economic indicators and earnings reports could introduce volatility, impacting the stock's performance.
3 Months Prediction
Target: November 12, 2025$240
$235
$245
$225
Description
Long-term bullish sentiment is expected as the company continues to innovate and expand. However, potential market corrections and economic uncertainties could lead to fluctuations. The MACD and moving averages support a positive outlook.
Analysis
Over the last three months, AMZN has shown resilience with a bullish trend. Key support is at $220, while resistance is at $240. The stock's performance is influenced by broader market trends and economic indicators, which could introduce volatility in the coming months.
Confidence Level
Potential Risks
Unforeseen macroeconomic events or changes in market sentiment could significantly impact the stock's trajectory.