AMZN Trading Predictions
1 Day Prediction
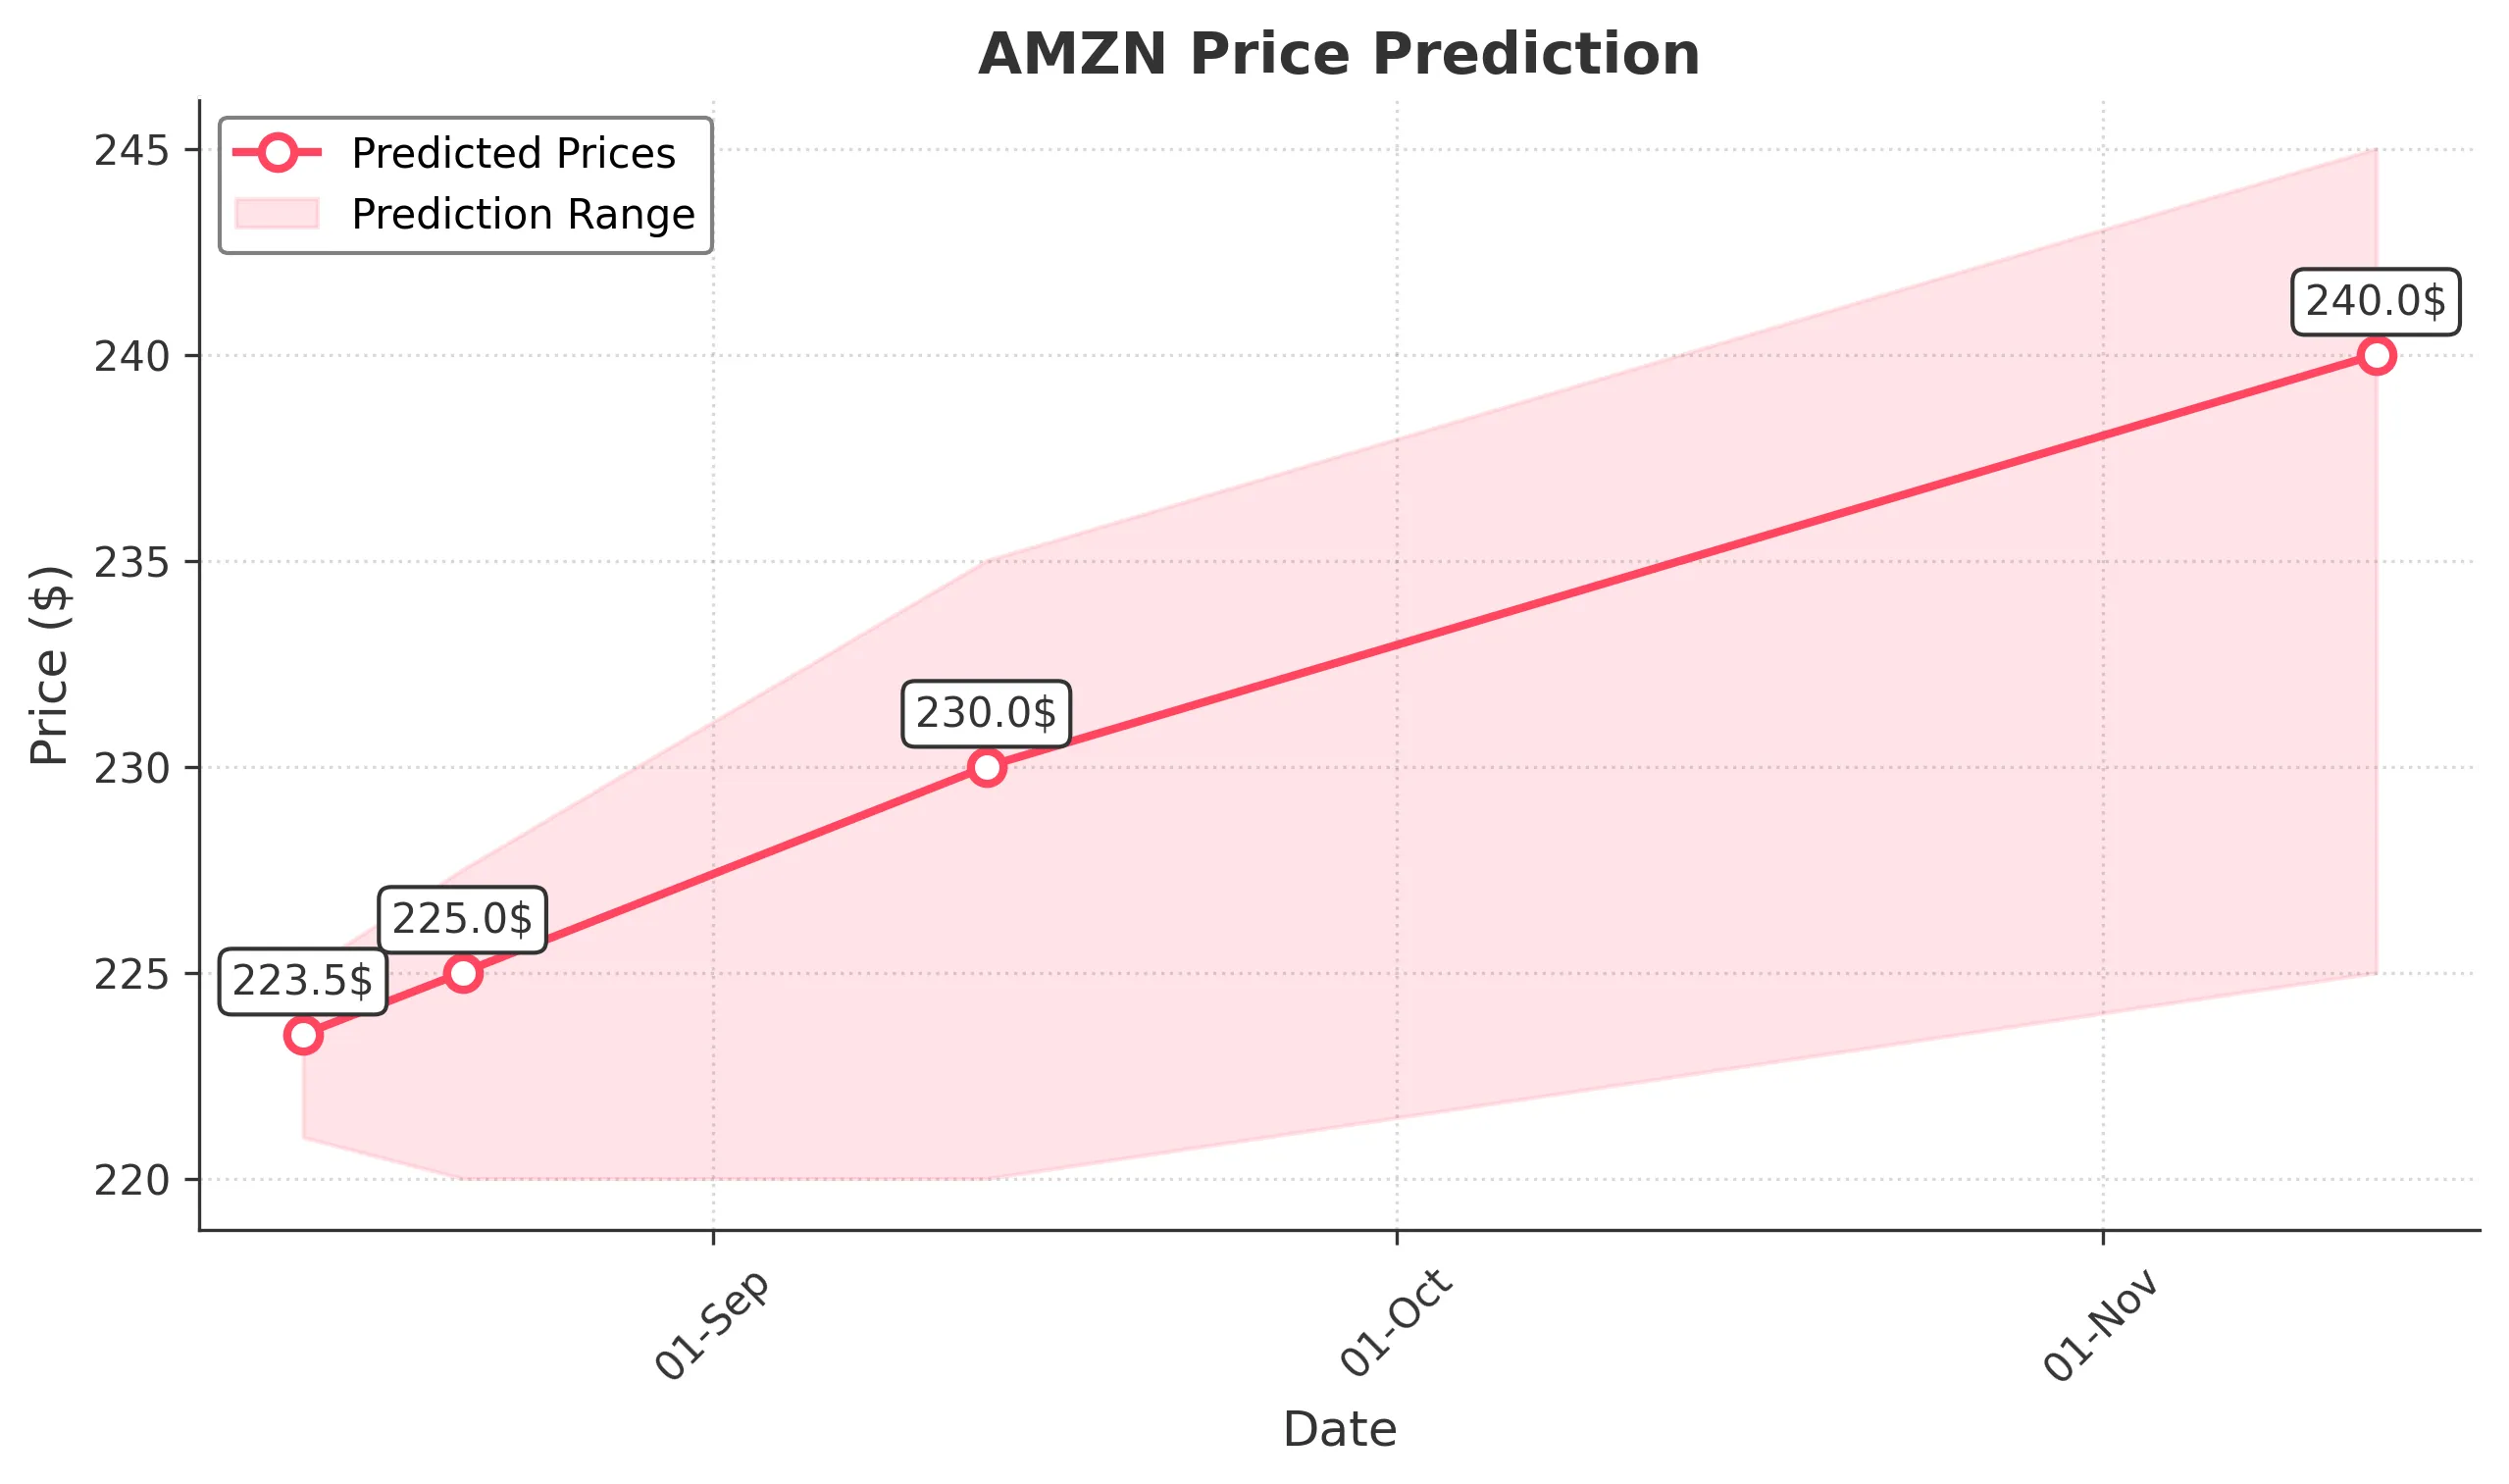
Target: August 14, 2025$223.5
$222.5
$225
$221
Description
The stock shows a slight bullish trend with a recent Doji pattern indicating indecision. RSI is neutral, and MACD is close to crossing above the signal line. Expect a modest increase in price with potential resistance at 225.
Analysis
Over the past 3 months, AMZN has shown a bullish trend with significant support at 210 and resistance around 230. Recent volume spikes indicate strong interest, but the recent drop to 214 suggests potential bearish pressure. Technical indicators are mixed, with RSI around 50 and MACD showing potential bullish momentum.
Confidence Level
Potential Risks
Market volatility and external news could impact the price. A bearish reversal is possible if the market sentiment shifts.
1 Week Prediction
Target: August 21, 2025$225
$223.5
$227.5
$220
Description
The stock is expected to continue its upward momentum, supported by recent bullish candlestick patterns. The MACD is showing a bullish crossover, and the RSI is approaching overbought territory, indicating potential upward movement.
Analysis
AMZN has been trending upward with key support at 220 and resistance at 230. The recent bullish patterns and increasing volume suggest strong buying interest. However, the RSI nearing overbought levels indicates caution, as a pullback could occur.
Confidence Level
Potential Risks
If market sentiment shifts negatively or if macroeconomic factors arise, the price could decline. Watch for any significant news that could impact tech stocks.
1 Month Prediction
Target: September 13, 2025$230
$225
$235
$220
Description
Expect continued bullish momentum as the stock approaches key Fibonacci retracement levels. The MACD remains bullish, and the RSI is stabilizing. A breakout above 230 could lead to further gains.
Analysis
The stock has shown resilience with a bullish trend, supported by strong volume. Key resistance at 230 is critical; a breakout could lead to further gains. However, the market's overall sentiment and external factors could introduce volatility.
Confidence Level
Potential Risks
Potential market corrections or negative news could impact the stock's performance. Monitor economic indicators closely.
3 Months Prediction
Target: November 13, 2025$240
$230
$245
$225
Description
Long-term bullish outlook as the stock is expected to break through resistance levels. The MACD indicates strong momentum, and the RSI suggests sustained buying interest. Watch for any macroeconomic changes that could affect tech stocks.
Analysis
AMZN has shown a strong upward trend with significant support at 220 and resistance at 240. The stock's performance is influenced by broader market trends and economic conditions. While bullish indicators are present, external factors could lead to volatility.
Confidence Level
Potential Risks
Long-term predictions are subject to greater uncertainty due to potential market shifts, economic downturns, or changes in investor sentiment.