AMZN Trading Predictions
1 Day Prediction
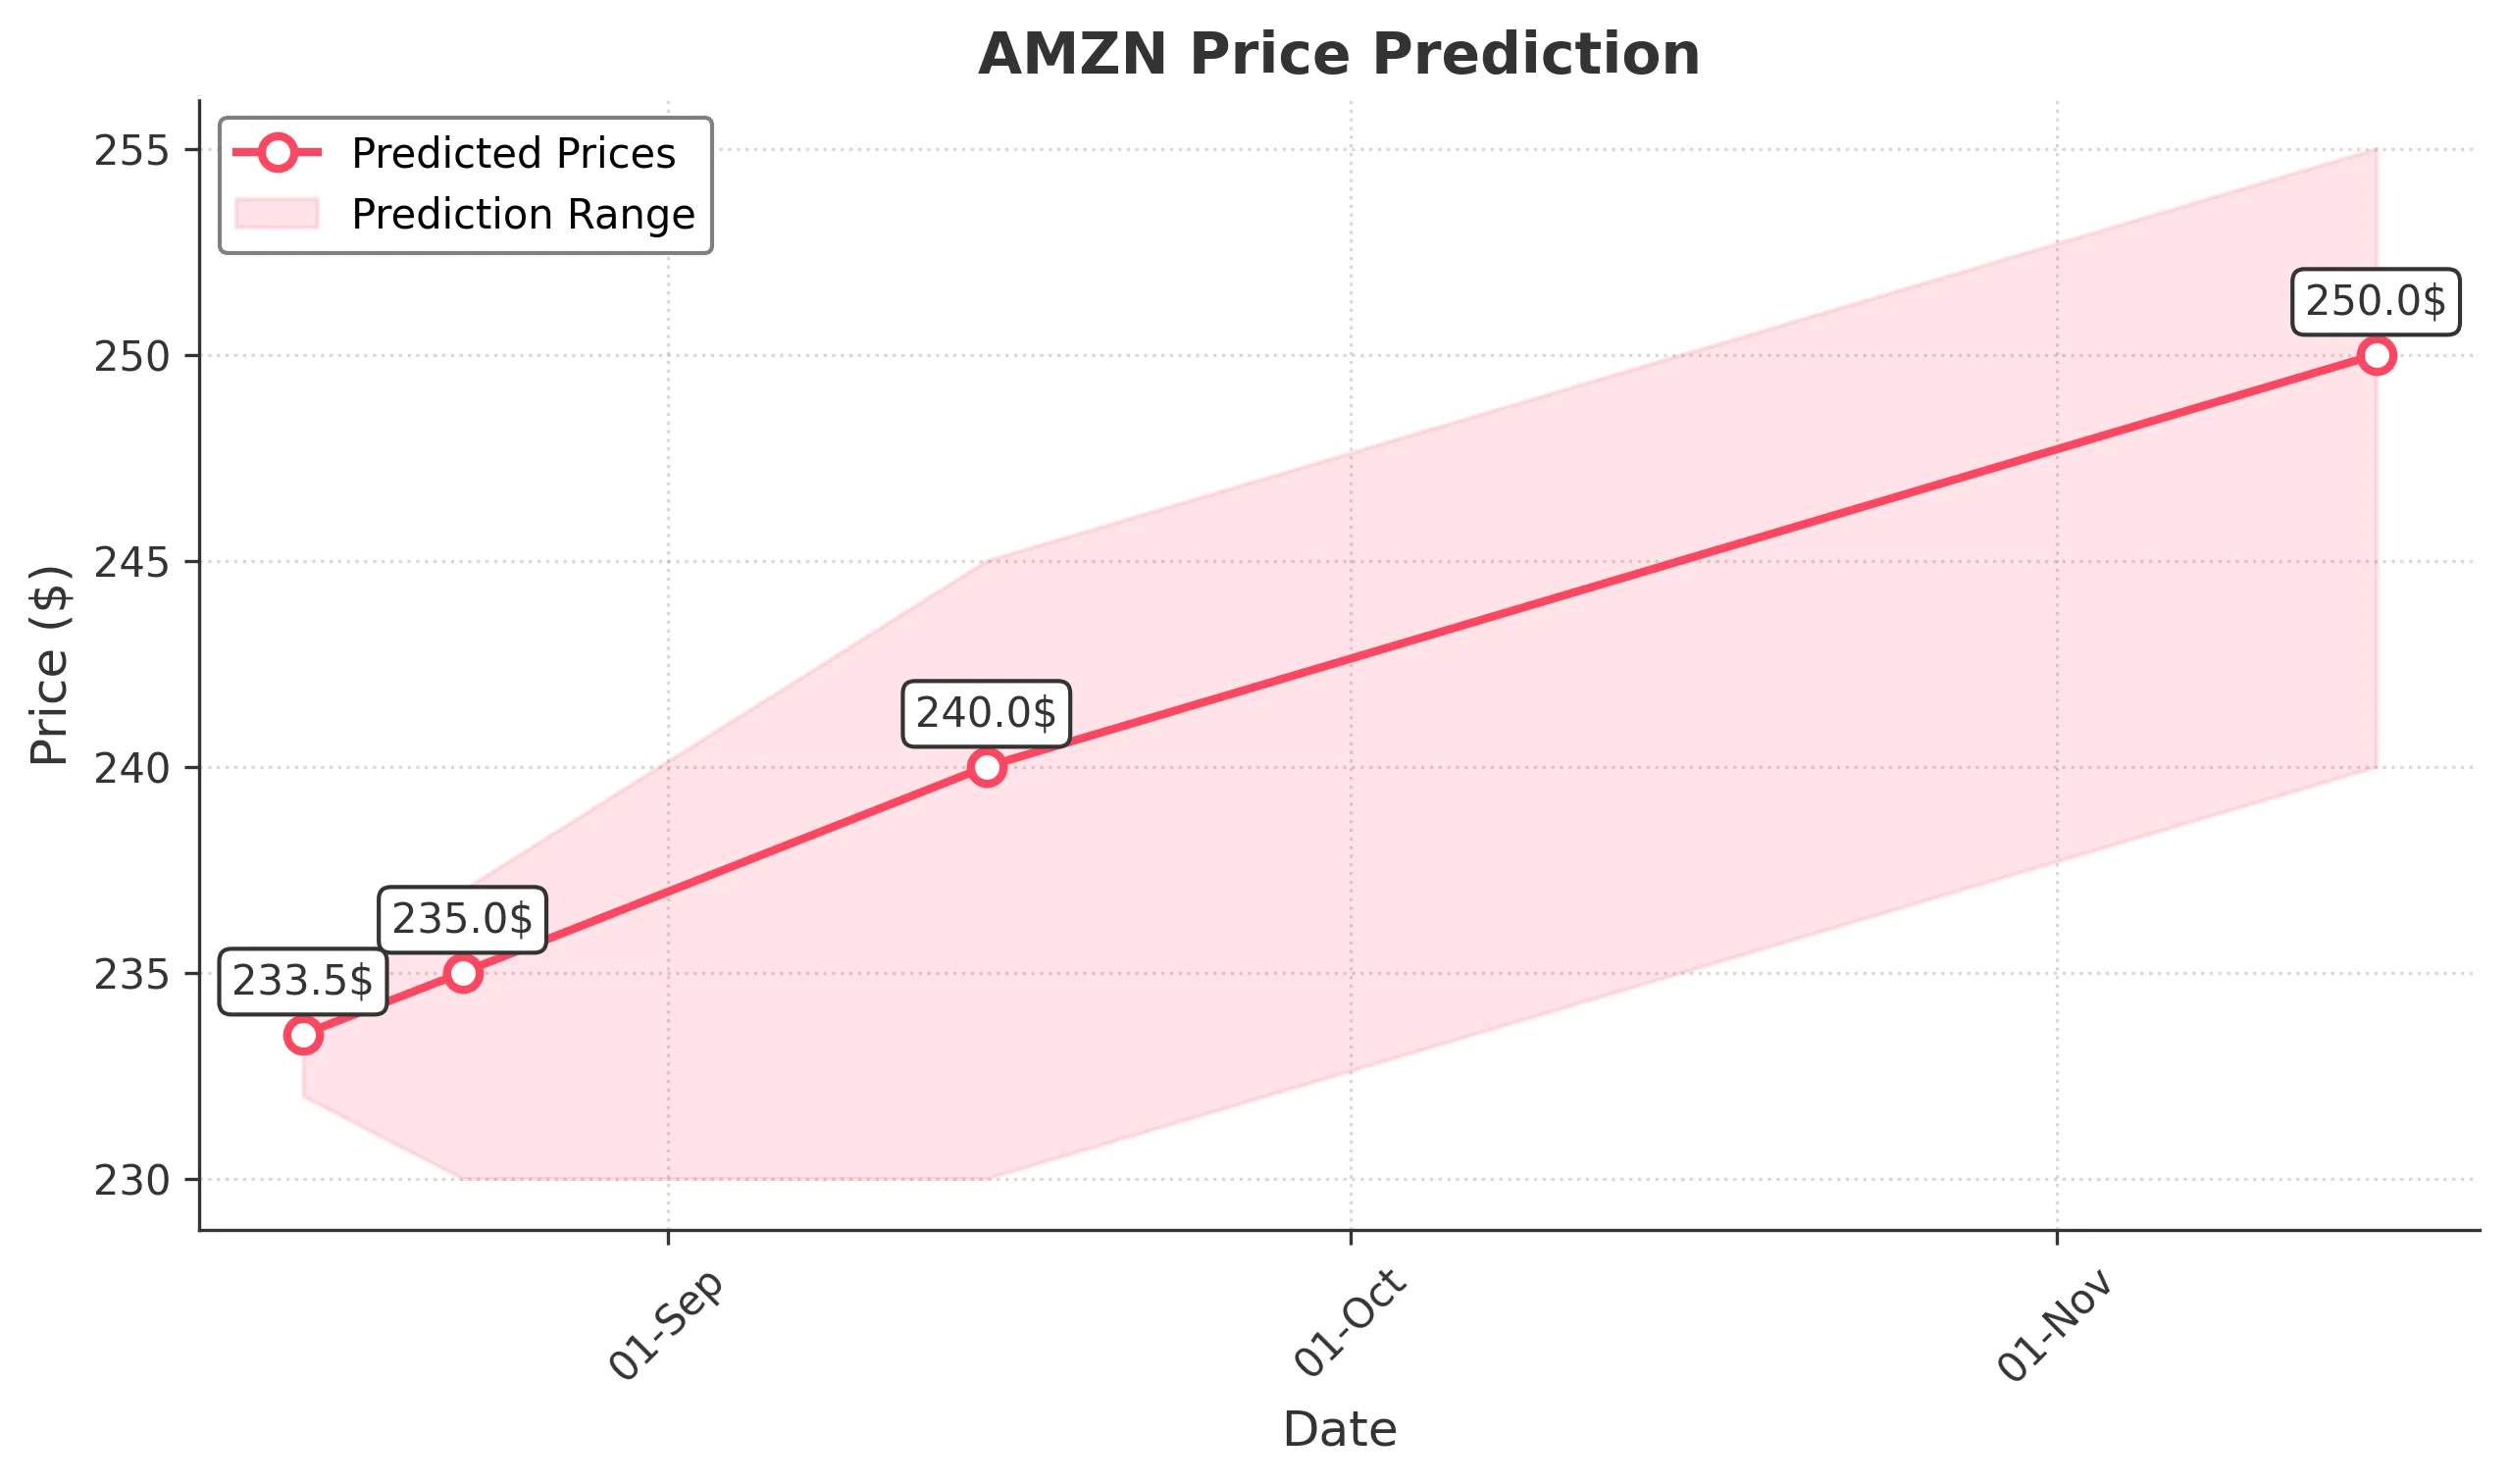
Target: August 16, 2025$233.5
$233
$234.5
$232
Description
The stock shows bullish momentum with a recent upward trend. The RSI is approaching overbought levels, indicating potential for a pullback. However, the MACD is positive, suggesting continued upward movement. Volume remains stable, supporting the bullish outlook.
Analysis
AMZN has shown a bullish trend over the past three months, with significant support at $220 and resistance around $236. The recent price action indicates a recovery from a dip, with the MACD and moving averages supporting upward momentum. However, the RSI nearing overbought levels suggests caution.
Confidence Level
Potential Risks
Potential market volatility and profit-taking could lead to a price pullback.
1 Week Prediction
Target: August 23, 2025$235
$234.5
$237
$230
Description
The stock is expected to maintain its upward trajectory, supported by strong buying interest. The Bollinger Bands indicate potential for a breakout. However, the RSI suggests caution as it approaches overbought territory, which could lead to a short-term pullback.
Analysis
Over the past three months, AMZN has experienced a bullish trend with key support at $220. The recent price action shows a recovery from a dip, with the MACD and moving averages indicating upward momentum. However, the RSI nearing overbought levels suggests potential for a pullback.
Confidence Level
Potential Risks
Market sentiment could shift due to macroeconomic news, impacting the stock's performance.
1 Month Prediction
Target: September 15, 2025$240
$235.5
$245
$230
Description
The stock is likely to continue its upward trend, driven by positive market sentiment and strong earnings reports. The Fibonacci retracement levels suggest a target around $240. However, the RSI indicates potential overbought conditions, which could lead to volatility.
Analysis
AMZN has shown a strong bullish trend with significant support at $220 and resistance around $245. The recent price action indicates a recovery, with the MACD and moving averages supporting upward momentum. However, the RSI nearing overbought levels suggests caution.
Confidence Level
Potential Risks
Unforeseen macroeconomic events or earnings reports could impact the stock's trajectory.
3 Months Prediction
Target: November 15, 2025$250
$245
$255
$240
Description
The stock is expected to reach new highs as market conditions improve and investor sentiment remains positive. The technical indicators suggest a strong bullish trend, but the RSI indicates potential overbought conditions, which could lead to corrections.
Analysis
AMZN has shown a bullish trend with key support at $220 and resistance around $255. The recent price action indicates a recovery, with the MACD and moving averages supporting upward momentum. However, the RSI nearing overbought levels suggests potential for a pullback.
Confidence Level
Potential Risks
Market volatility and economic uncertainties could lead to unexpected price movements.