AUDUSDX Trading Predictions
1 Day Prediction
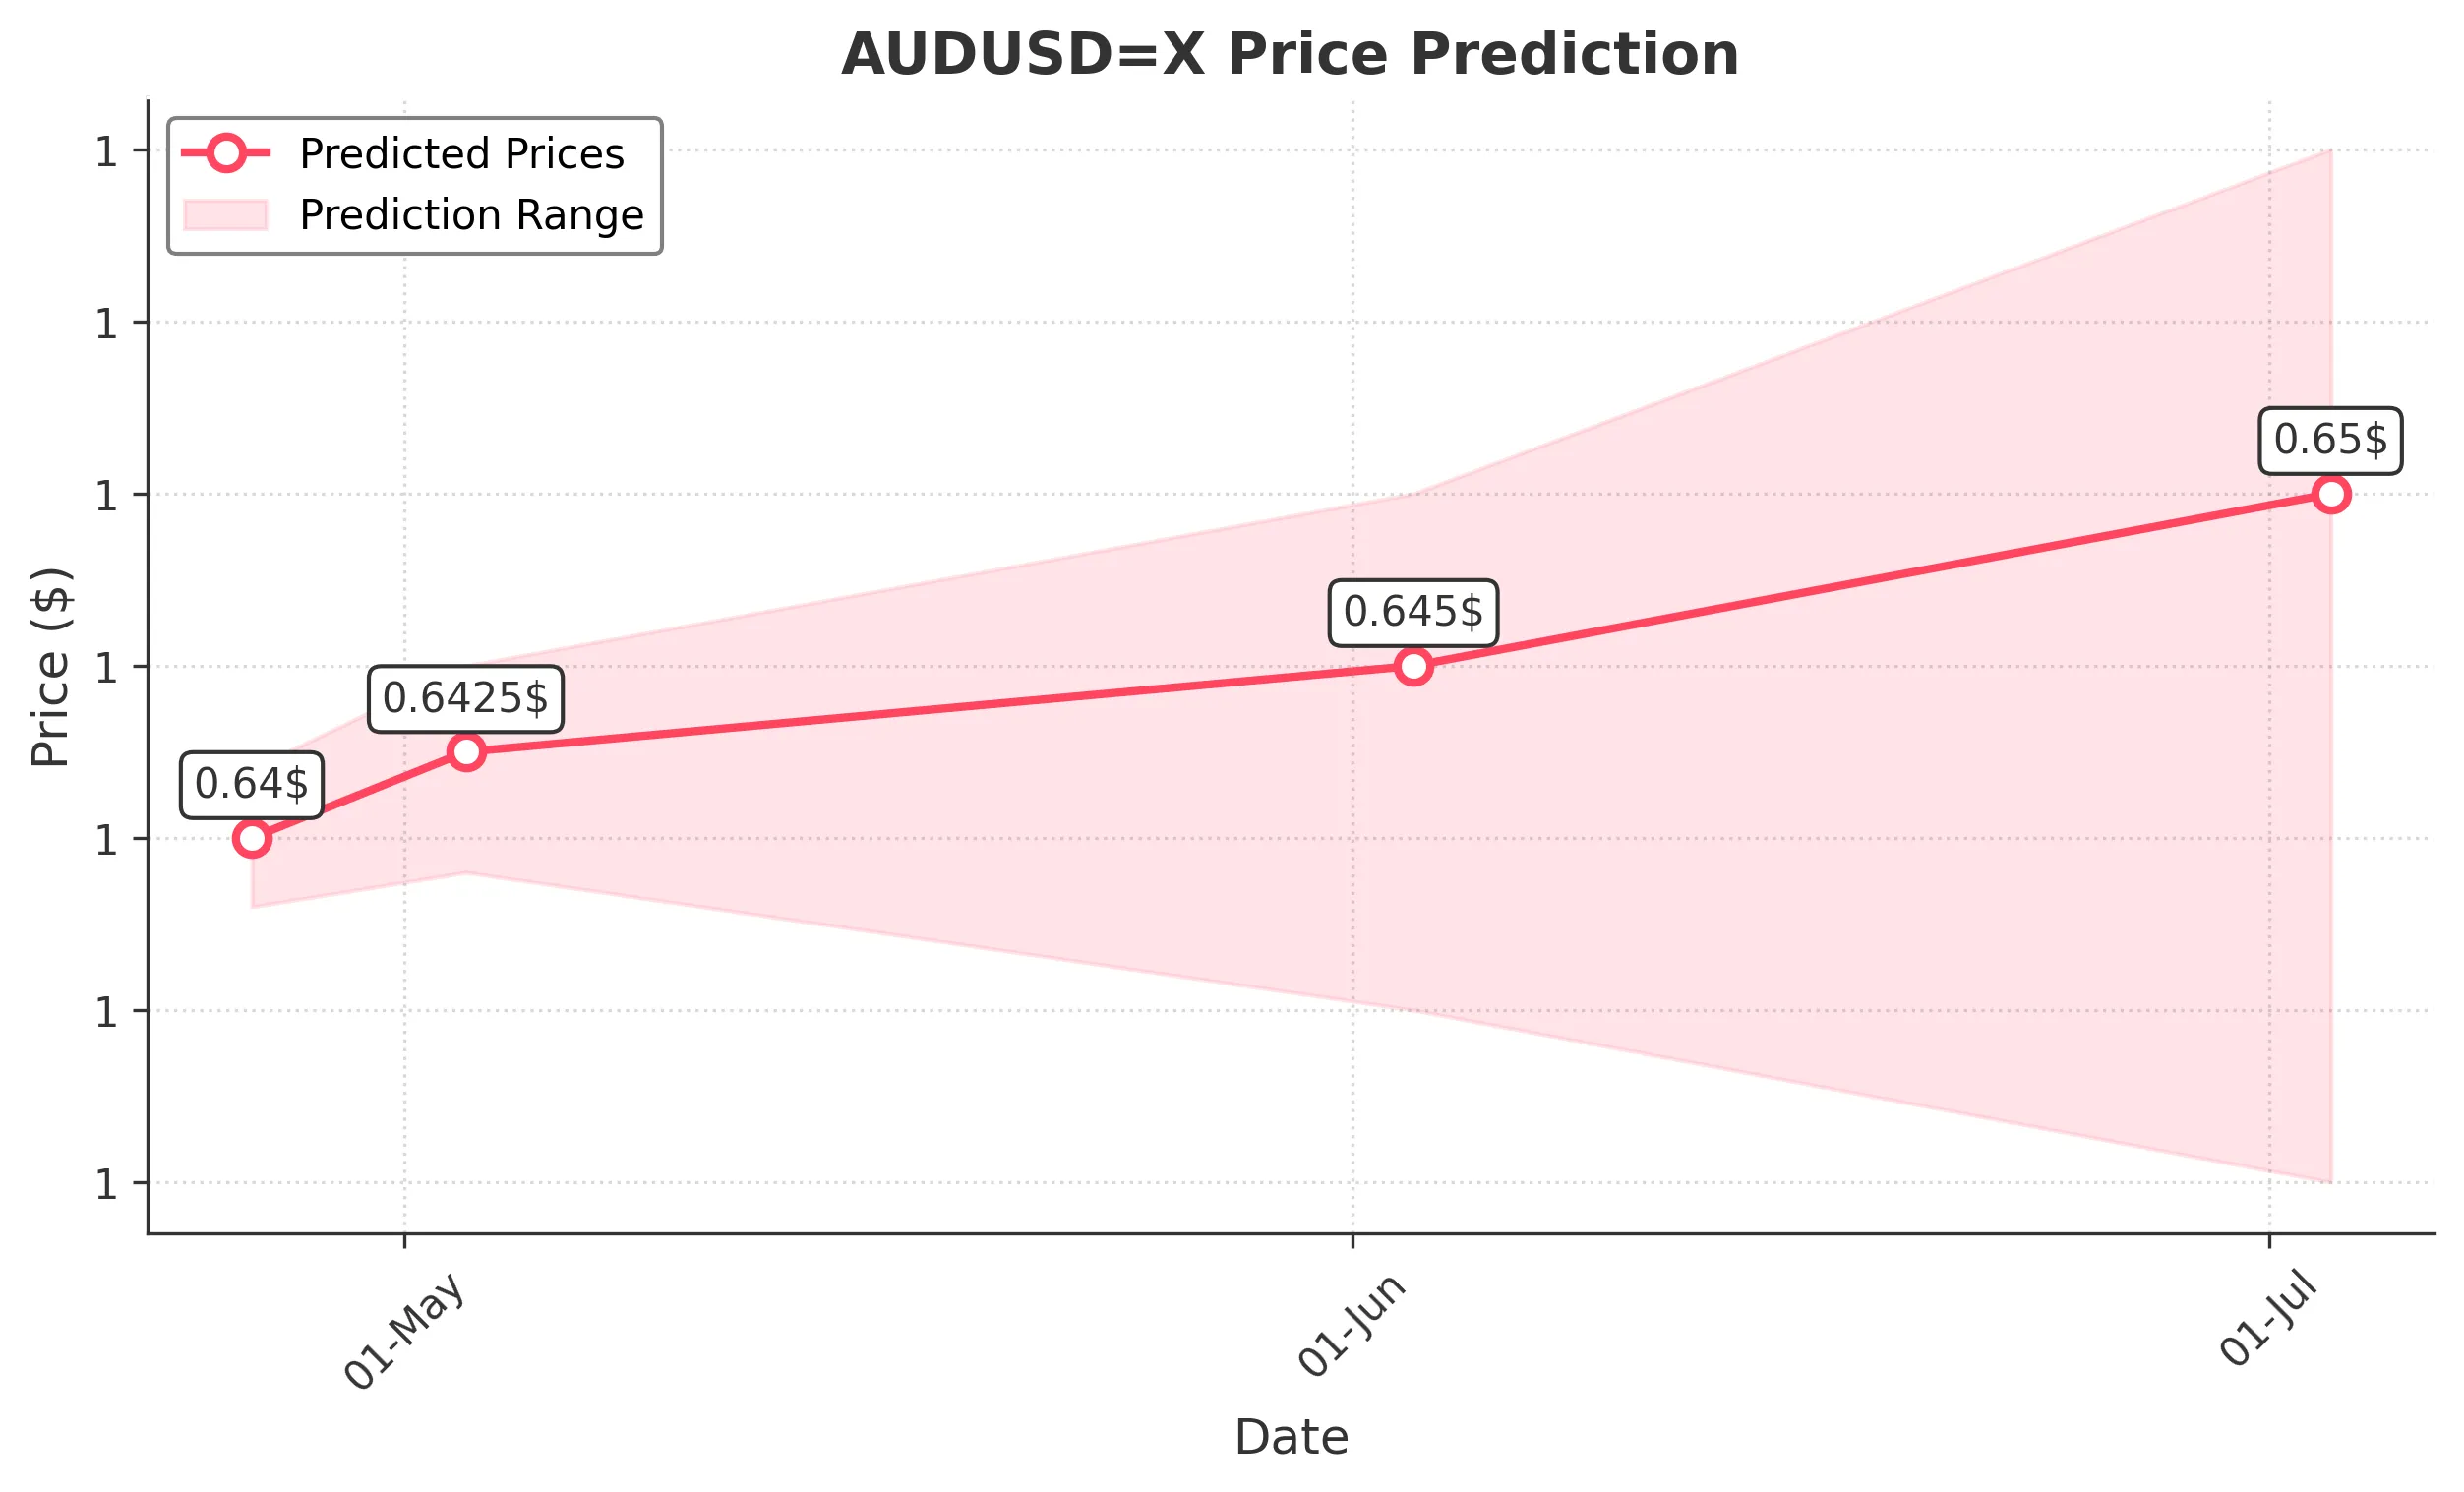
Target: April 26, 2025$0.64
$0.639
$0.642
$0.638
Description
The recent bullish trend suggests a potential upward movement. The MACD is showing a bullish crossover, and RSI is near 60, indicating strength. However, resistance at 0.642 may limit gains.
Analysis
The past 3 months show a bullish trend with significant support at 0.630 and resistance at 0.642. The MACD and RSI indicate upward momentum, but recent price fluctuations suggest caution.
Confidence Level
Potential Risks
Market volatility and external economic news could impact this prediction.
1 Week Prediction
Target: May 3, 2025$0.6425
$0.64
$0.645
$0.639
Description
The bullish momentum is expected to continue, supported by a recent breakout above 0.640. However, the RSI nearing overbought levels may lead to a pullback. Watch for volume spikes for confirmation.
Analysis
The stock has shown a consistent upward trend, with key support at 0.630. The MACD indicates bullish momentum, but the RSI suggests caution as it approaches overbought territory.
Confidence Level
Potential Risks
Potential market corrections and geopolitical events could affect price stability.
1 Month Prediction
Target: June 3, 2025$0.645
$0.64
$0.65
$0.635
Description
Expect continued bullish sentiment as the price approaches the Fibonacci retracement level of 0.650. However, watch for potential resistance at this level, which could trigger profit-taking.
Analysis
The stock has been in a bullish phase, with strong support at 0.630. The MACD and RSI indicate upward momentum, but the proximity to resistance levels suggests a cautious approach.
Confidence Level
Potential Risks
Economic data releases and central bank decisions could introduce volatility.
3 Months Prediction
Target: July 3, 2025$0.65
$0.645
$0.66
$0.63
Description
Long-term bullish outlook as the price may test the 0.660 resistance level. The overall trend remains positive, but market sentiment and external factors could lead to fluctuations.
Analysis
The stock has shown a strong upward trend, with key support at 0.630. The MACD indicates bullish momentum, but potential resistance at 0.660 may lead to volatility in the coming months.
Confidence Level
Potential Risks
Unforeseen economic events and market corrections could impact the forecast.