AUDUSDX Trading Predictions
1 Day Prediction
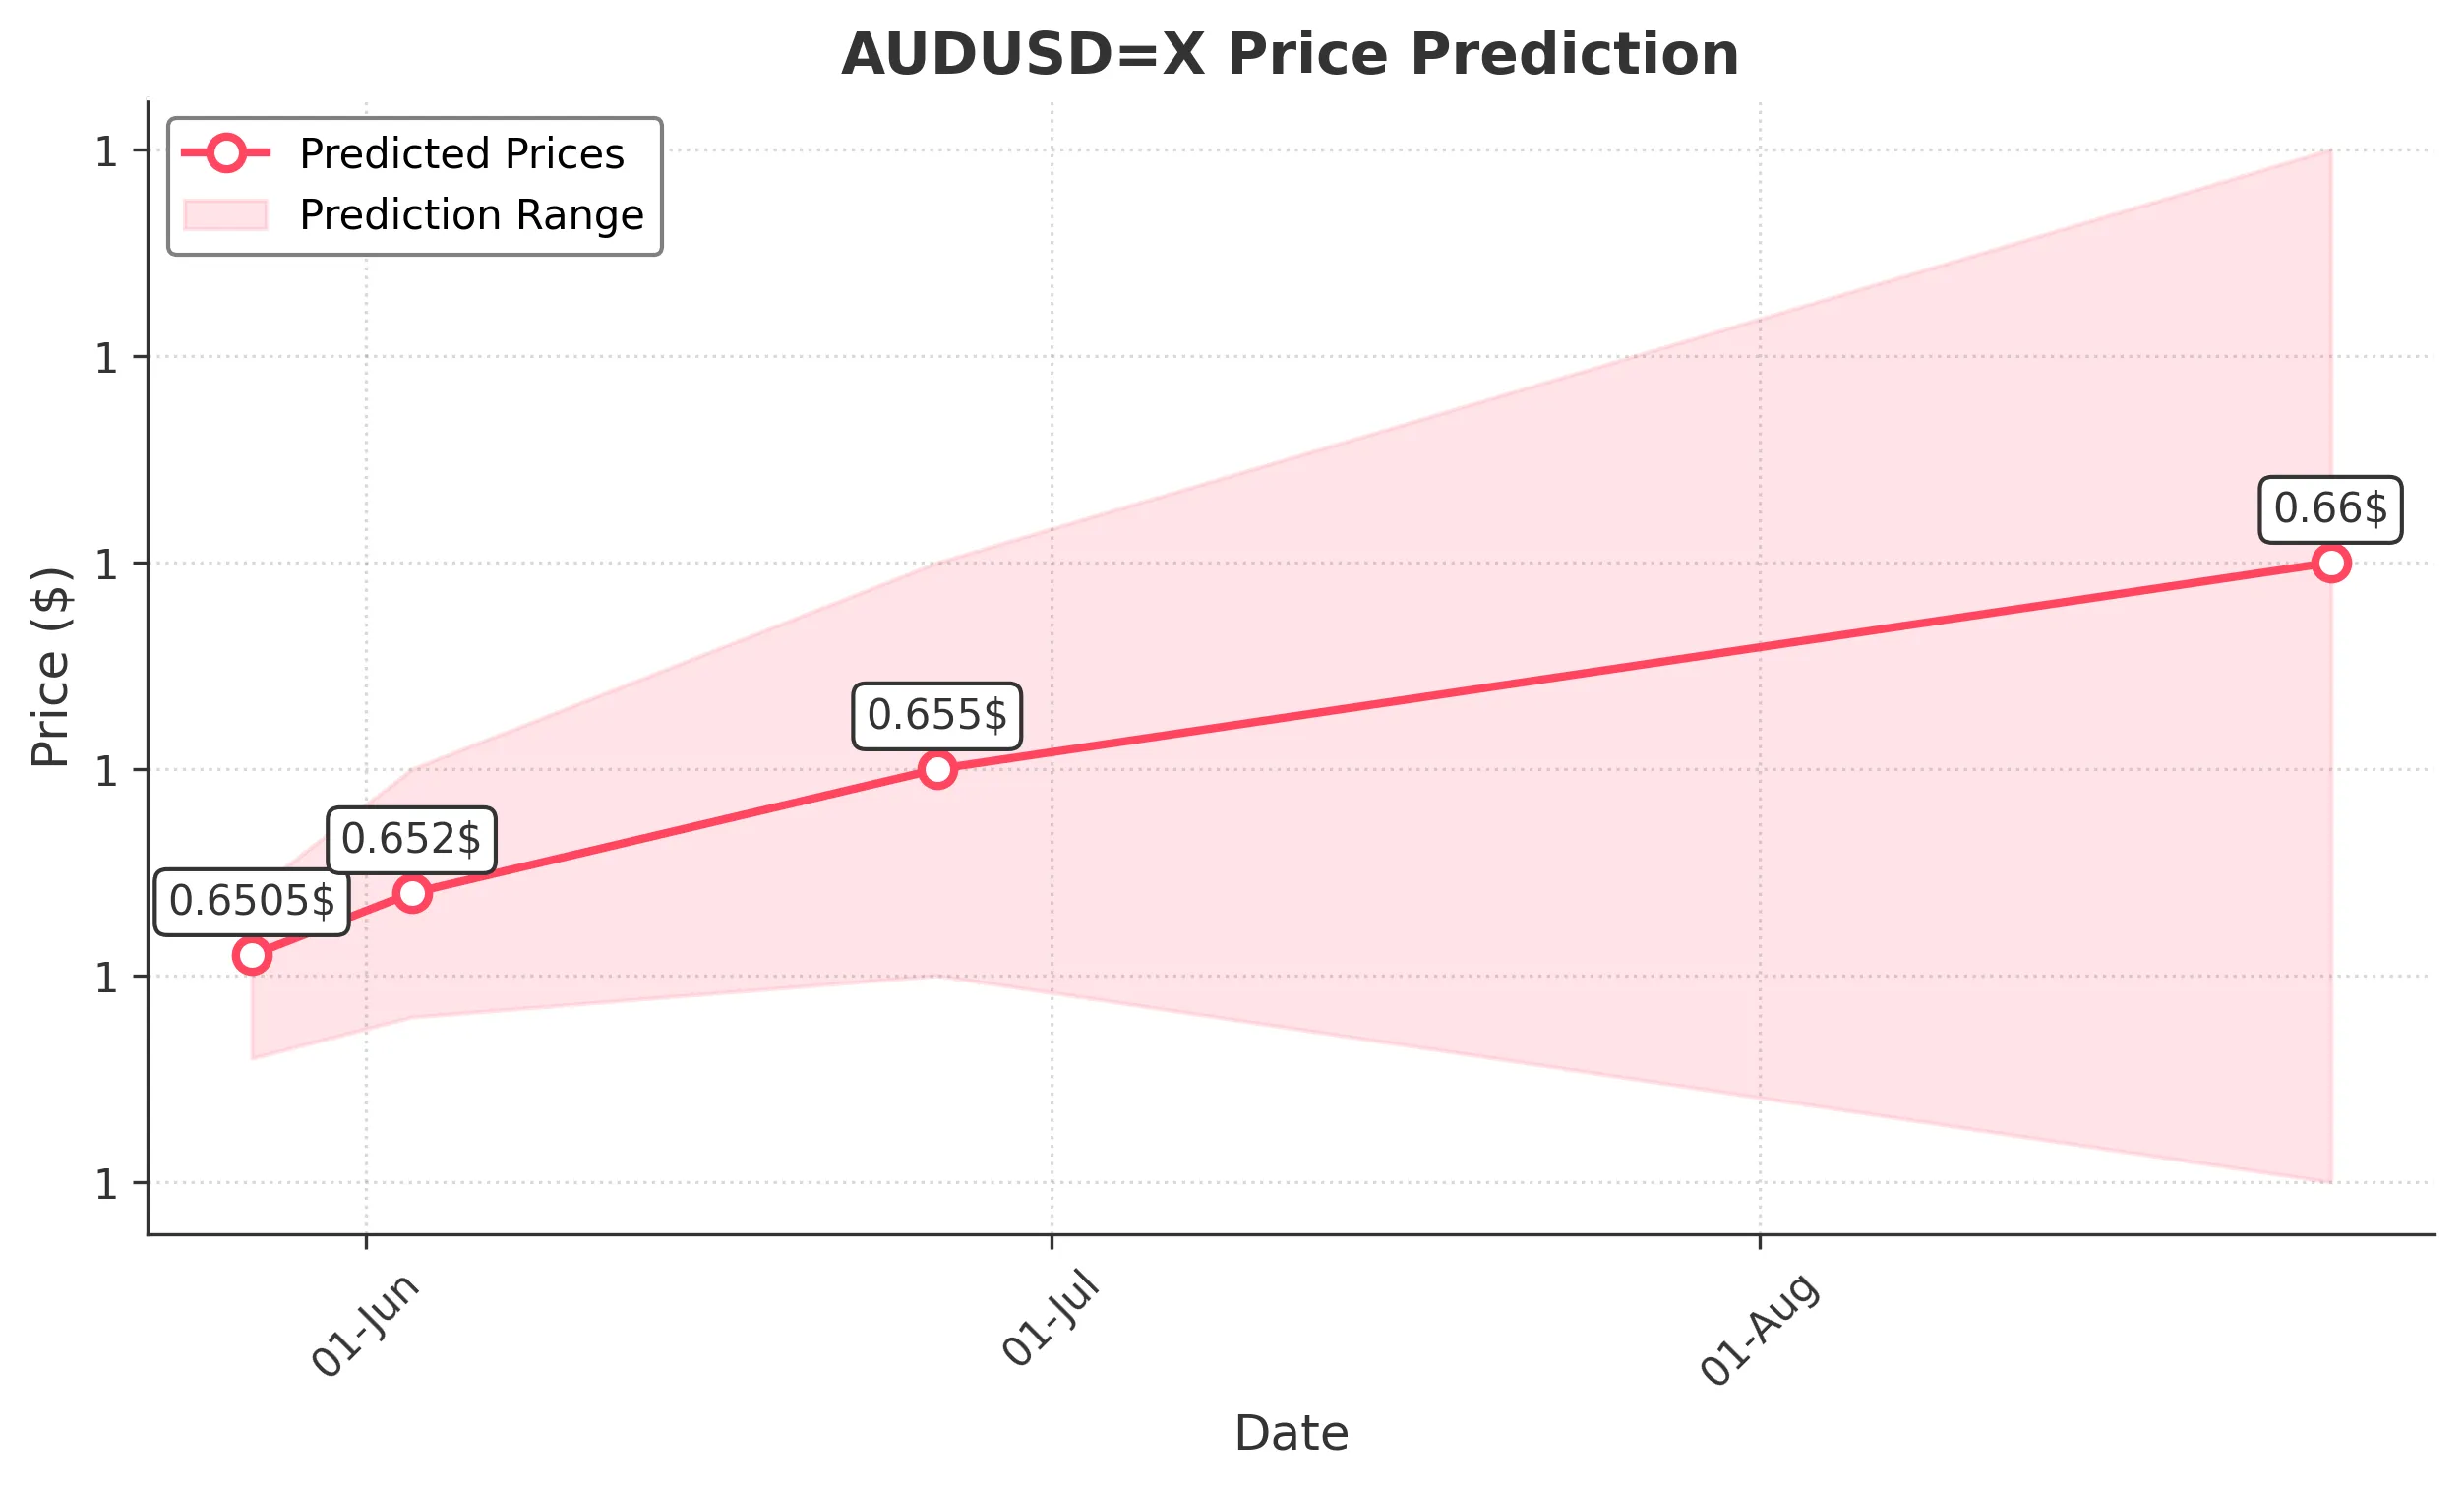
Target: May 27, 2025$0.6505
$0.65
$0.652
$0.648
Description
The recent bullish trend, supported by a strong MACD crossover and RSI indicating upward momentum, suggests a potential increase in price. The last candlestick pattern shows a bullish engulfing, reinforcing the upward sentiment.
Analysis
Over the past 3 months, AUDUSD has shown a bullish trend with significant support at 0.6400 and resistance around 0.6520. The MACD is positive, and RSI is approaching overbought levels, indicating potential for a pullback.
Confidence Level
Potential Risks
Market volatility and external economic news could impact the prediction.
1 Week Prediction
Target: June 3, 2025$0.652
$0.6505
$0.655
$0.649
Description
The bullish momentum is expected to continue, with the price likely to test the resistance level at 0.6550. The recent upward trend and positive market sentiment support this prediction.
Analysis
The stock has been trending upward, with key support at 0.6400. The RSI is nearing overbought territory, suggesting caution. Volume has been increasing, indicating strong buying interest.
Confidence Level
Potential Risks
Potential economic data releases could lead to unexpected volatility.
1 Month Prediction
Target: June 26, 2025$0.655
$0.652
$0.66
$0.65
Description
If the bullish trend persists, the price may reach 0.6550, driven by strong market sentiment and technical indicators. However, caution is advised as the RSI indicates potential overbought conditions.
Analysis
The overall trend remains bullish, with significant resistance at 0.6550. The MACD is positive, but the RSI suggests a potential pullback. Volume patterns indicate strong buying, but caution is warranted.
Confidence Level
Potential Risks
Market corrections or negative news could reverse the trend.
3 Months Prediction
Target: August 26, 2025$0.66
$0.655
$0.67
$0.645
Description
The price may continue to rise towards 0.6600, supported by bullish market sentiment and technical indicators. However, the potential for a market correction exists, especially if economic conditions change.
Analysis
The stock has shown a strong bullish trend, but the RSI indicates overbought conditions. Key support is at 0.6400, and resistance at 0.6700. Volume has been increasing, but caution is needed as market conditions can change rapidly.
Confidence Level
Potential Risks
Unforeseen economic events could lead to significant volatility.