AUDUSDX Trading Predictions
1 Day Prediction
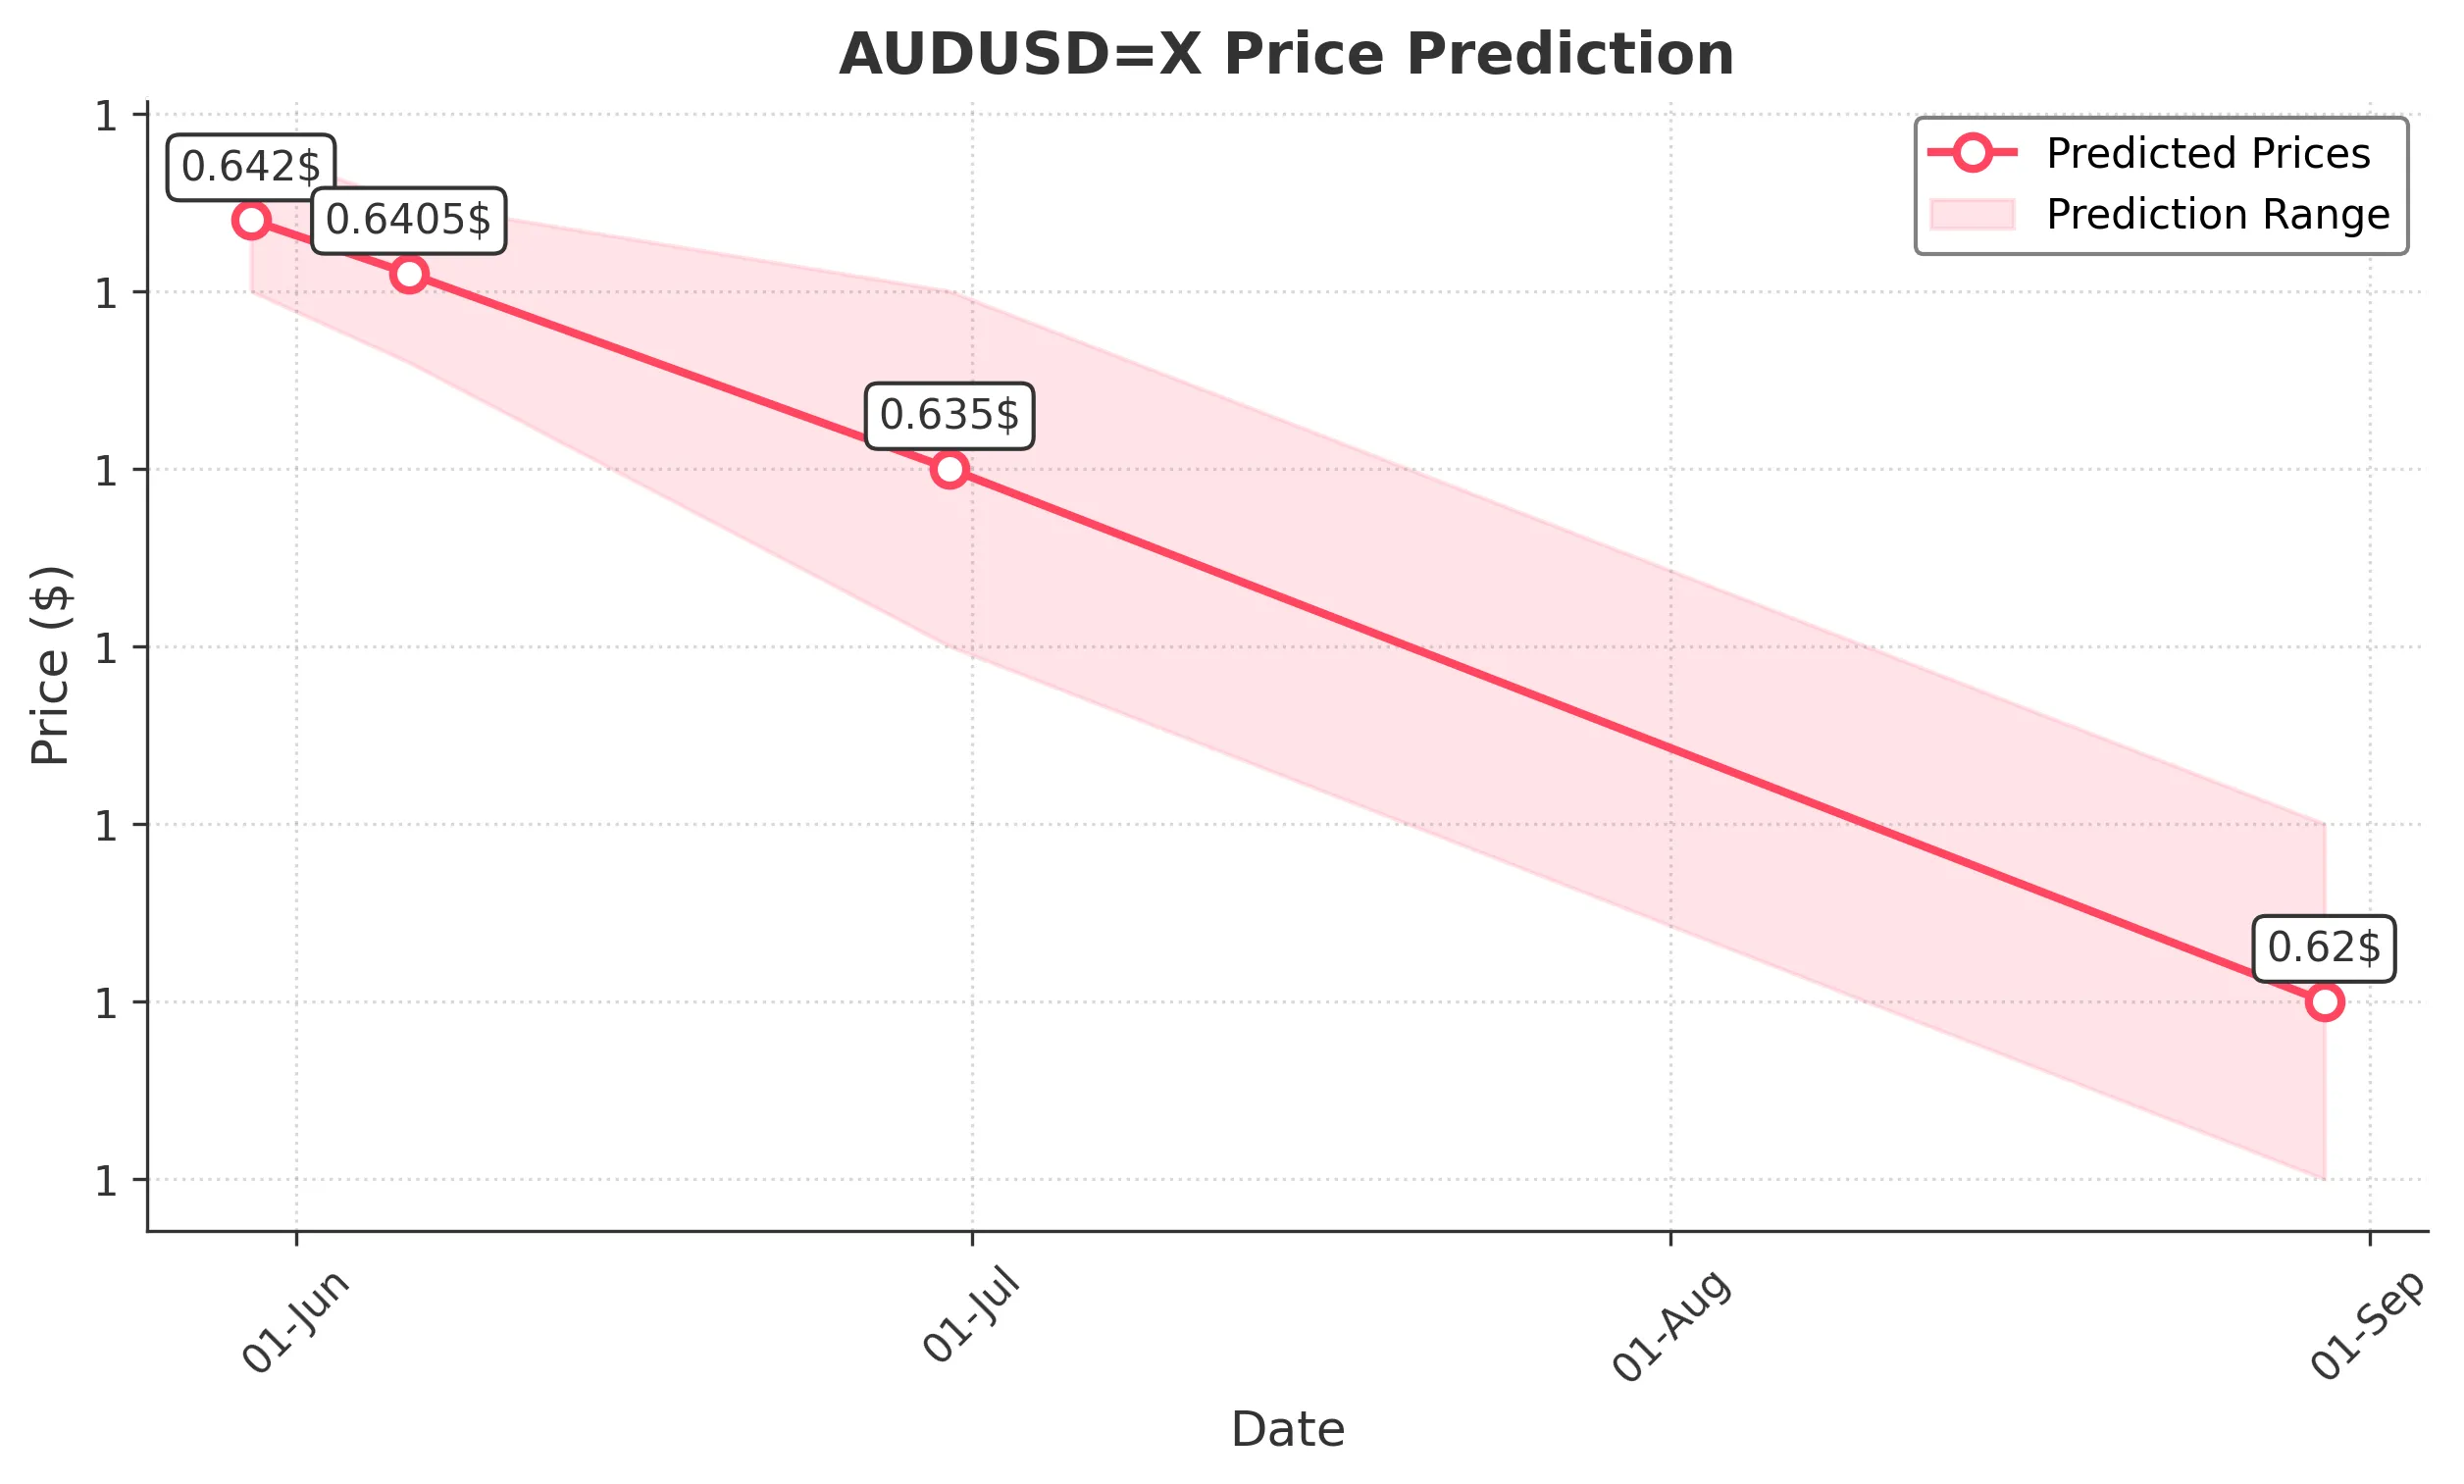
Target: May 30, 2025$0.642
$0.6415
$0.644
$0.64
Description
The recent price action shows a slight bearish trend with a potential reversal. The RSI is approaching overbought levels, indicating a possible pullback. The MACD is showing a bearish crossover, suggesting downward momentum. Volume remains low, indicating weak conviction.
Analysis
Over the past 3 months, AUDUSD has shown a bullish trend with significant resistance around 0.6500. Recent price fluctuations indicate a potential reversal, with support at 0.6400. Technical indicators like the MACD and RSI suggest caution, while volume patterns indicate low trading activity.
Confidence Level
Potential Risks
Market volatility and external news could impact the price unexpectedly.
1 Week Prediction
Target: June 6, 2025$0.6405
$0.641
$0.6425
$0.638
Description
The bearish momentum may continue into next week as the price approaches key support levels. The Bollinger Bands are tightening, indicating potential volatility. The market sentiment is cautious, and any negative macroeconomic news could exacerbate downward pressure.
Analysis
The stock has been in a consolidation phase, with key support at 0.6400. The RSI indicates a neutral stance, while the MACD shows a bearish trend. Volume has been low, suggesting a lack of strong buying interest. Overall, the outlook remains cautious.
Confidence Level
Potential Risks
Unforeseen economic data releases could lead to sudden price movements.
1 Month Prediction
Target: June 30, 2025$0.635
$0.638
$0.64
$0.63
Description
Expect continued bearish pressure as the market reacts to potential economic shifts. The Fibonacci retracement levels suggest a target around 0.6350. The overall market sentiment is bearish, and any negative economic indicators could push prices lower.
Analysis
The past three months have shown a bearish trend with significant resistance at 0.6500. The stock is currently testing support levels around 0.6400. Technical indicators suggest a potential downward trend, with the MACD and RSI indicating bearish momentum.
Confidence Level
Potential Risks
Economic data releases and geopolitical events could significantly alter market dynamics.
3 Months Prediction
Target: August 30, 2025$0.62
$0.623
$0.625
$0.615
Description
Long-term bearish sentiment may prevail as economic conditions evolve. The price may test lower support levels around 0.6200. The overall market sentiment is cautious, and any adverse economic developments could lead to further declines.
Analysis
The stock has been in a bearish trend, with significant resistance at 0.6500. The technical indicators suggest a potential continuation of this trend, with the MACD and RSI indicating bearish momentum. Volume patterns show low trading activity, indicating weak conviction.
Confidence Level
Potential Risks
Long-term predictions are highly uncertain due to potential economic shifts and market volatility.