AUDUSDX Trading Predictions
1 Day Prediction
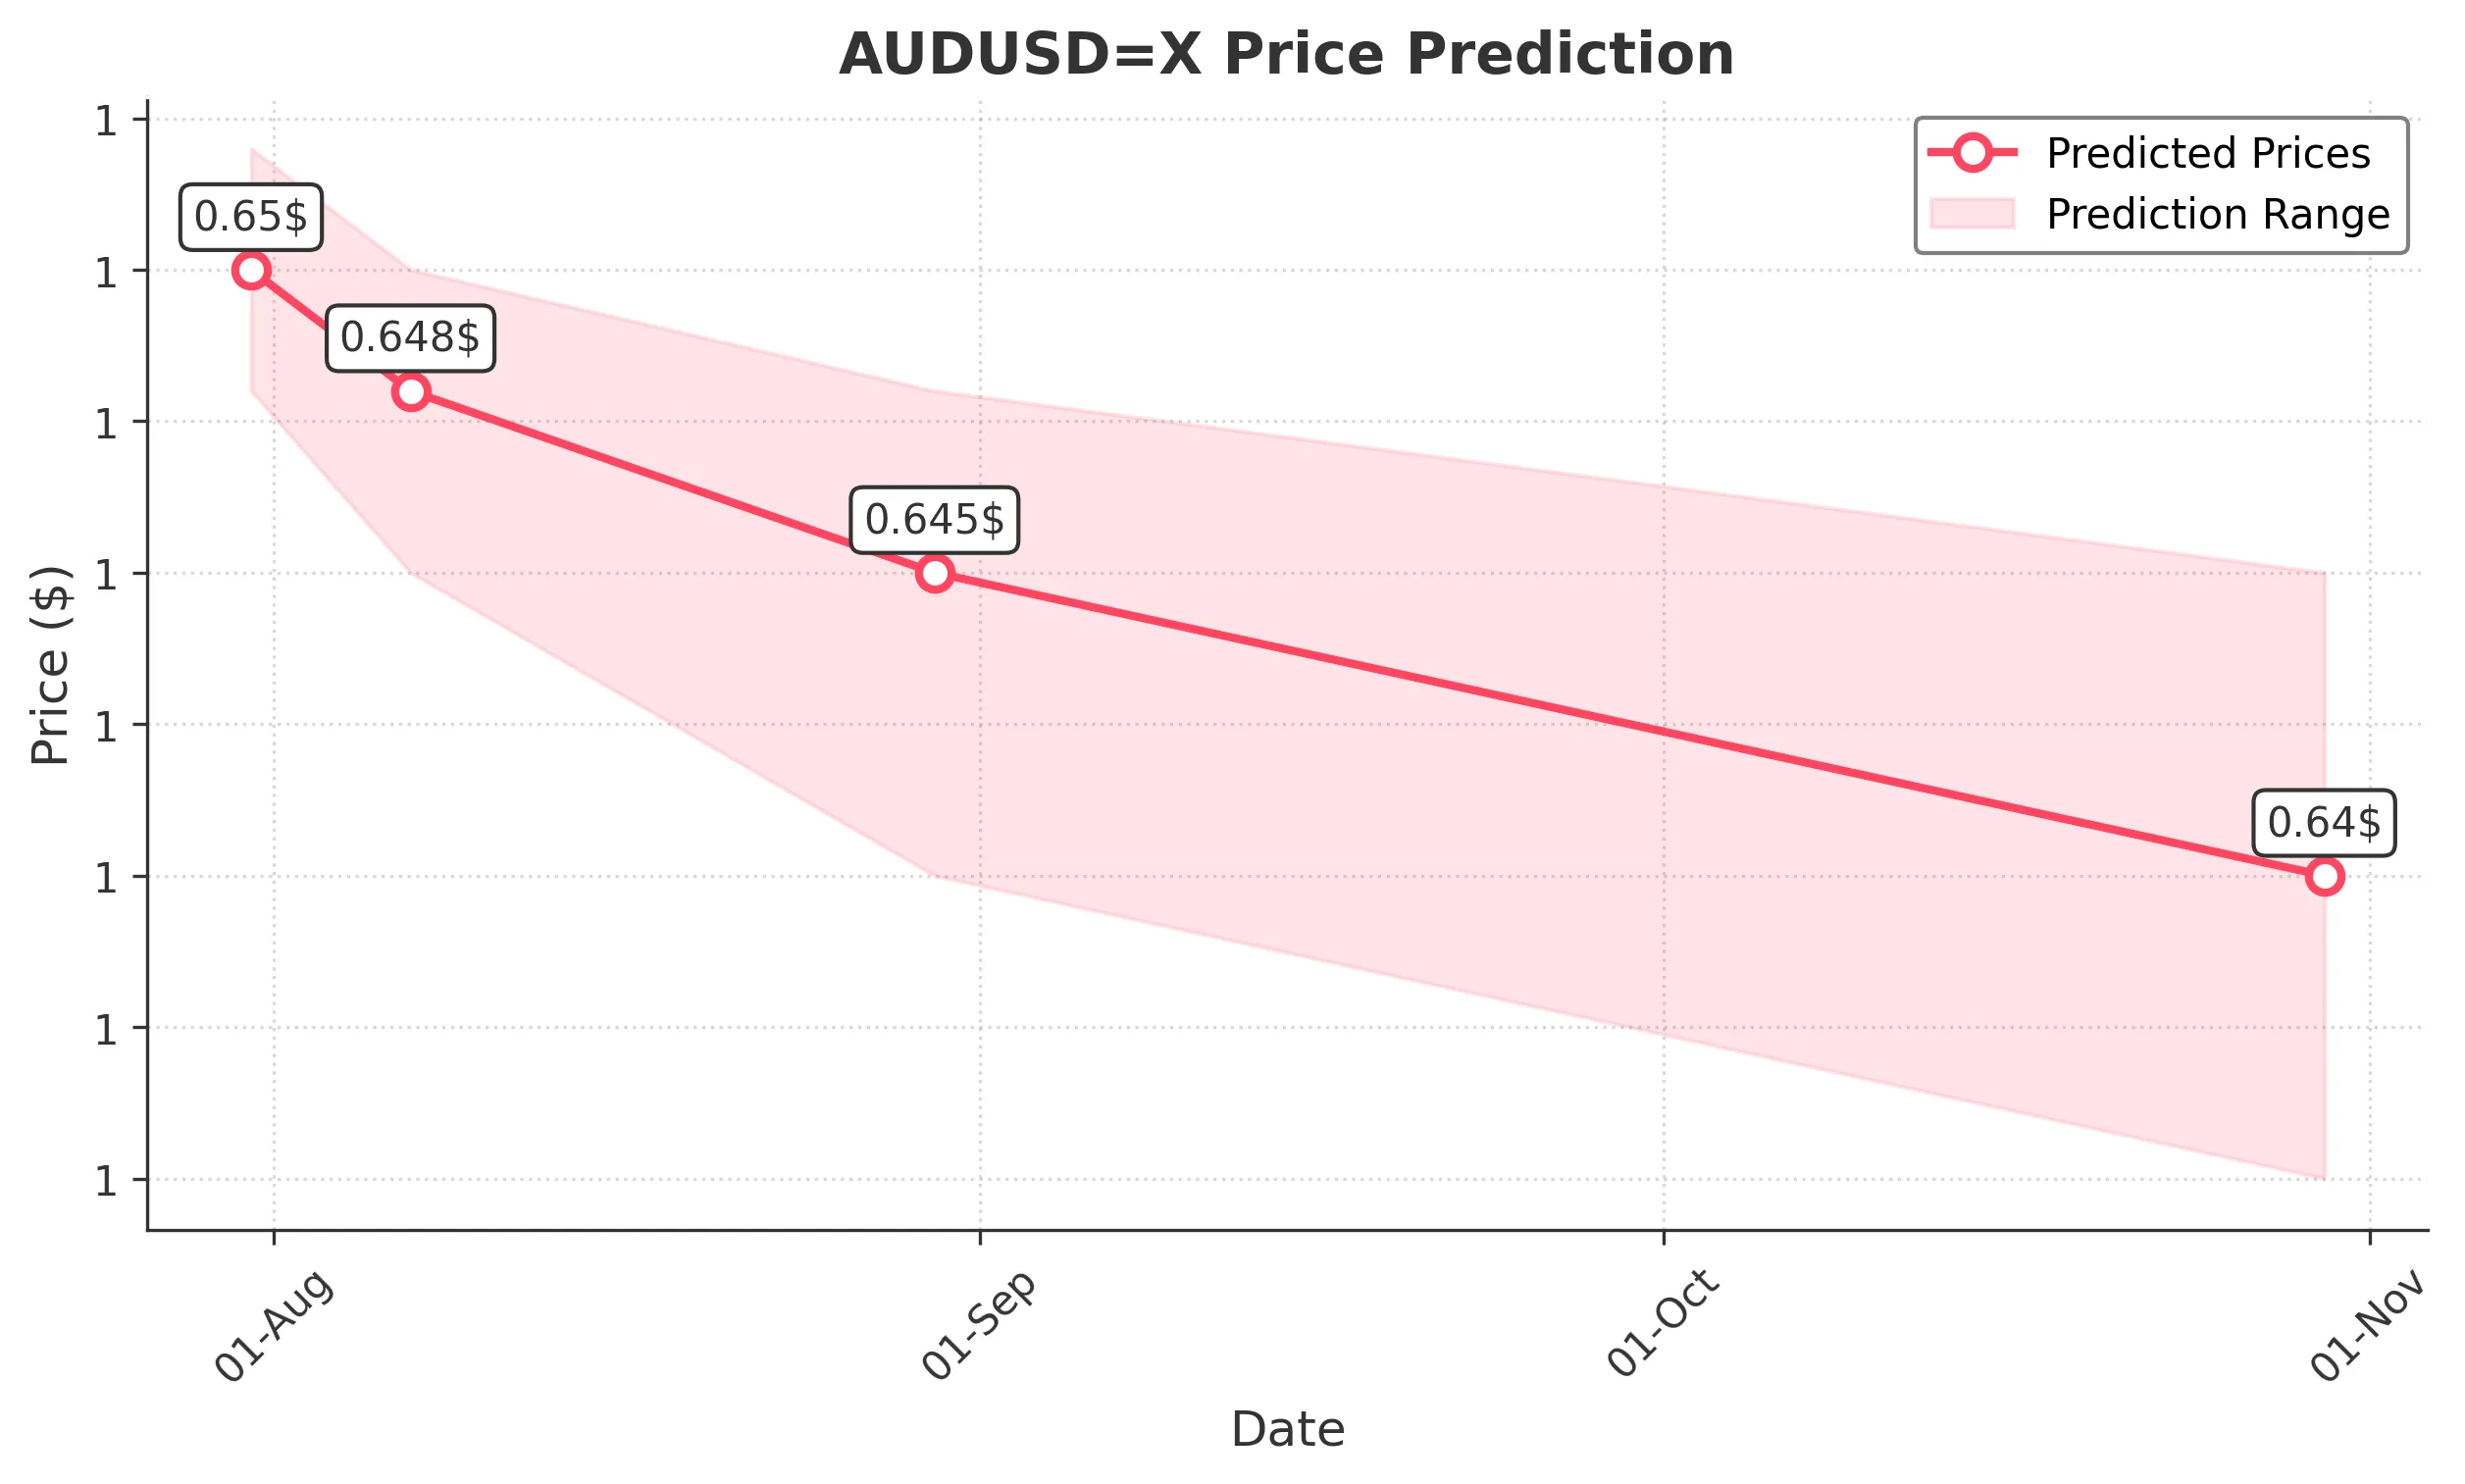
Target: July 31, 2025$0.65
$0.6505
$0.652
$0.648
Description
The recent bearish trend suggests a slight decline. The RSI indicates overbought conditions, while MACD shows a potential crossover. A Doji pattern indicates indecision, leading to a predicted close around 0.650.
Analysis
The past three months show a bullish trend with significant resistance at 0.660. Recent price action indicates a potential reversal, with RSI nearing overbought levels. Volume has been stable, but recent spikes suggest increased interest.
Confidence Level
Potential Risks
Market volatility and external news could impact this prediction significantly.
1 Week Prediction
Target: August 7, 2025$0.648
$0.649
$0.65
$0.645
Description
Expecting a continued bearish trend as the market reacts to recent highs. The MACD is showing a bearish divergence, and the Bollinger Bands indicate potential downward movement. A close around 0.648 is likely.
Analysis
The stock has shown a bullish trend but is now facing resistance at 0.660. The recent price action suggests a potential pullback, with support around 0.645. Volume patterns indicate a decrease in buying interest.
Confidence Level
Potential Risks
Unforeseen macroeconomic events could alter market sentiment and affect prices.
1 Month Prediction
Target: August 30, 2025$0.645
$0.646
$0.648
$0.64
Description
The bearish trend is expected to continue as the market adjusts to recent highs. The RSI is approaching oversold territory, indicating potential for a rebound, but overall sentiment remains cautious.
Analysis
The last three months have shown a bullish trend, but recent price action indicates a potential reversal. Key support at 0.640 is critical, and the market sentiment is mixed, with some bearish signals emerging.
Confidence Level
Potential Risks
Market volatility and external economic factors could lead to unexpected price movements.
3 Months Prediction
Target: October 30, 2025$0.64
$0.642
$0.645
$0.635
Description
Long-term bearish sentiment is anticipated as the market reacts to macroeconomic factors. The Fibonacci retracement levels suggest a potential decline towards 0.640, with support at 0.635.
Analysis
The stock has shown a strong bullish trend but is now facing resistance. The overall market sentiment is shifting, with bearish indicators emerging. Key support levels will be crucial in determining future price action.
Confidence Level
Potential Risks
Economic data releases and geopolitical events could significantly impact market direction.