AUDUSDX Trading Predictions
1 Day Prediction
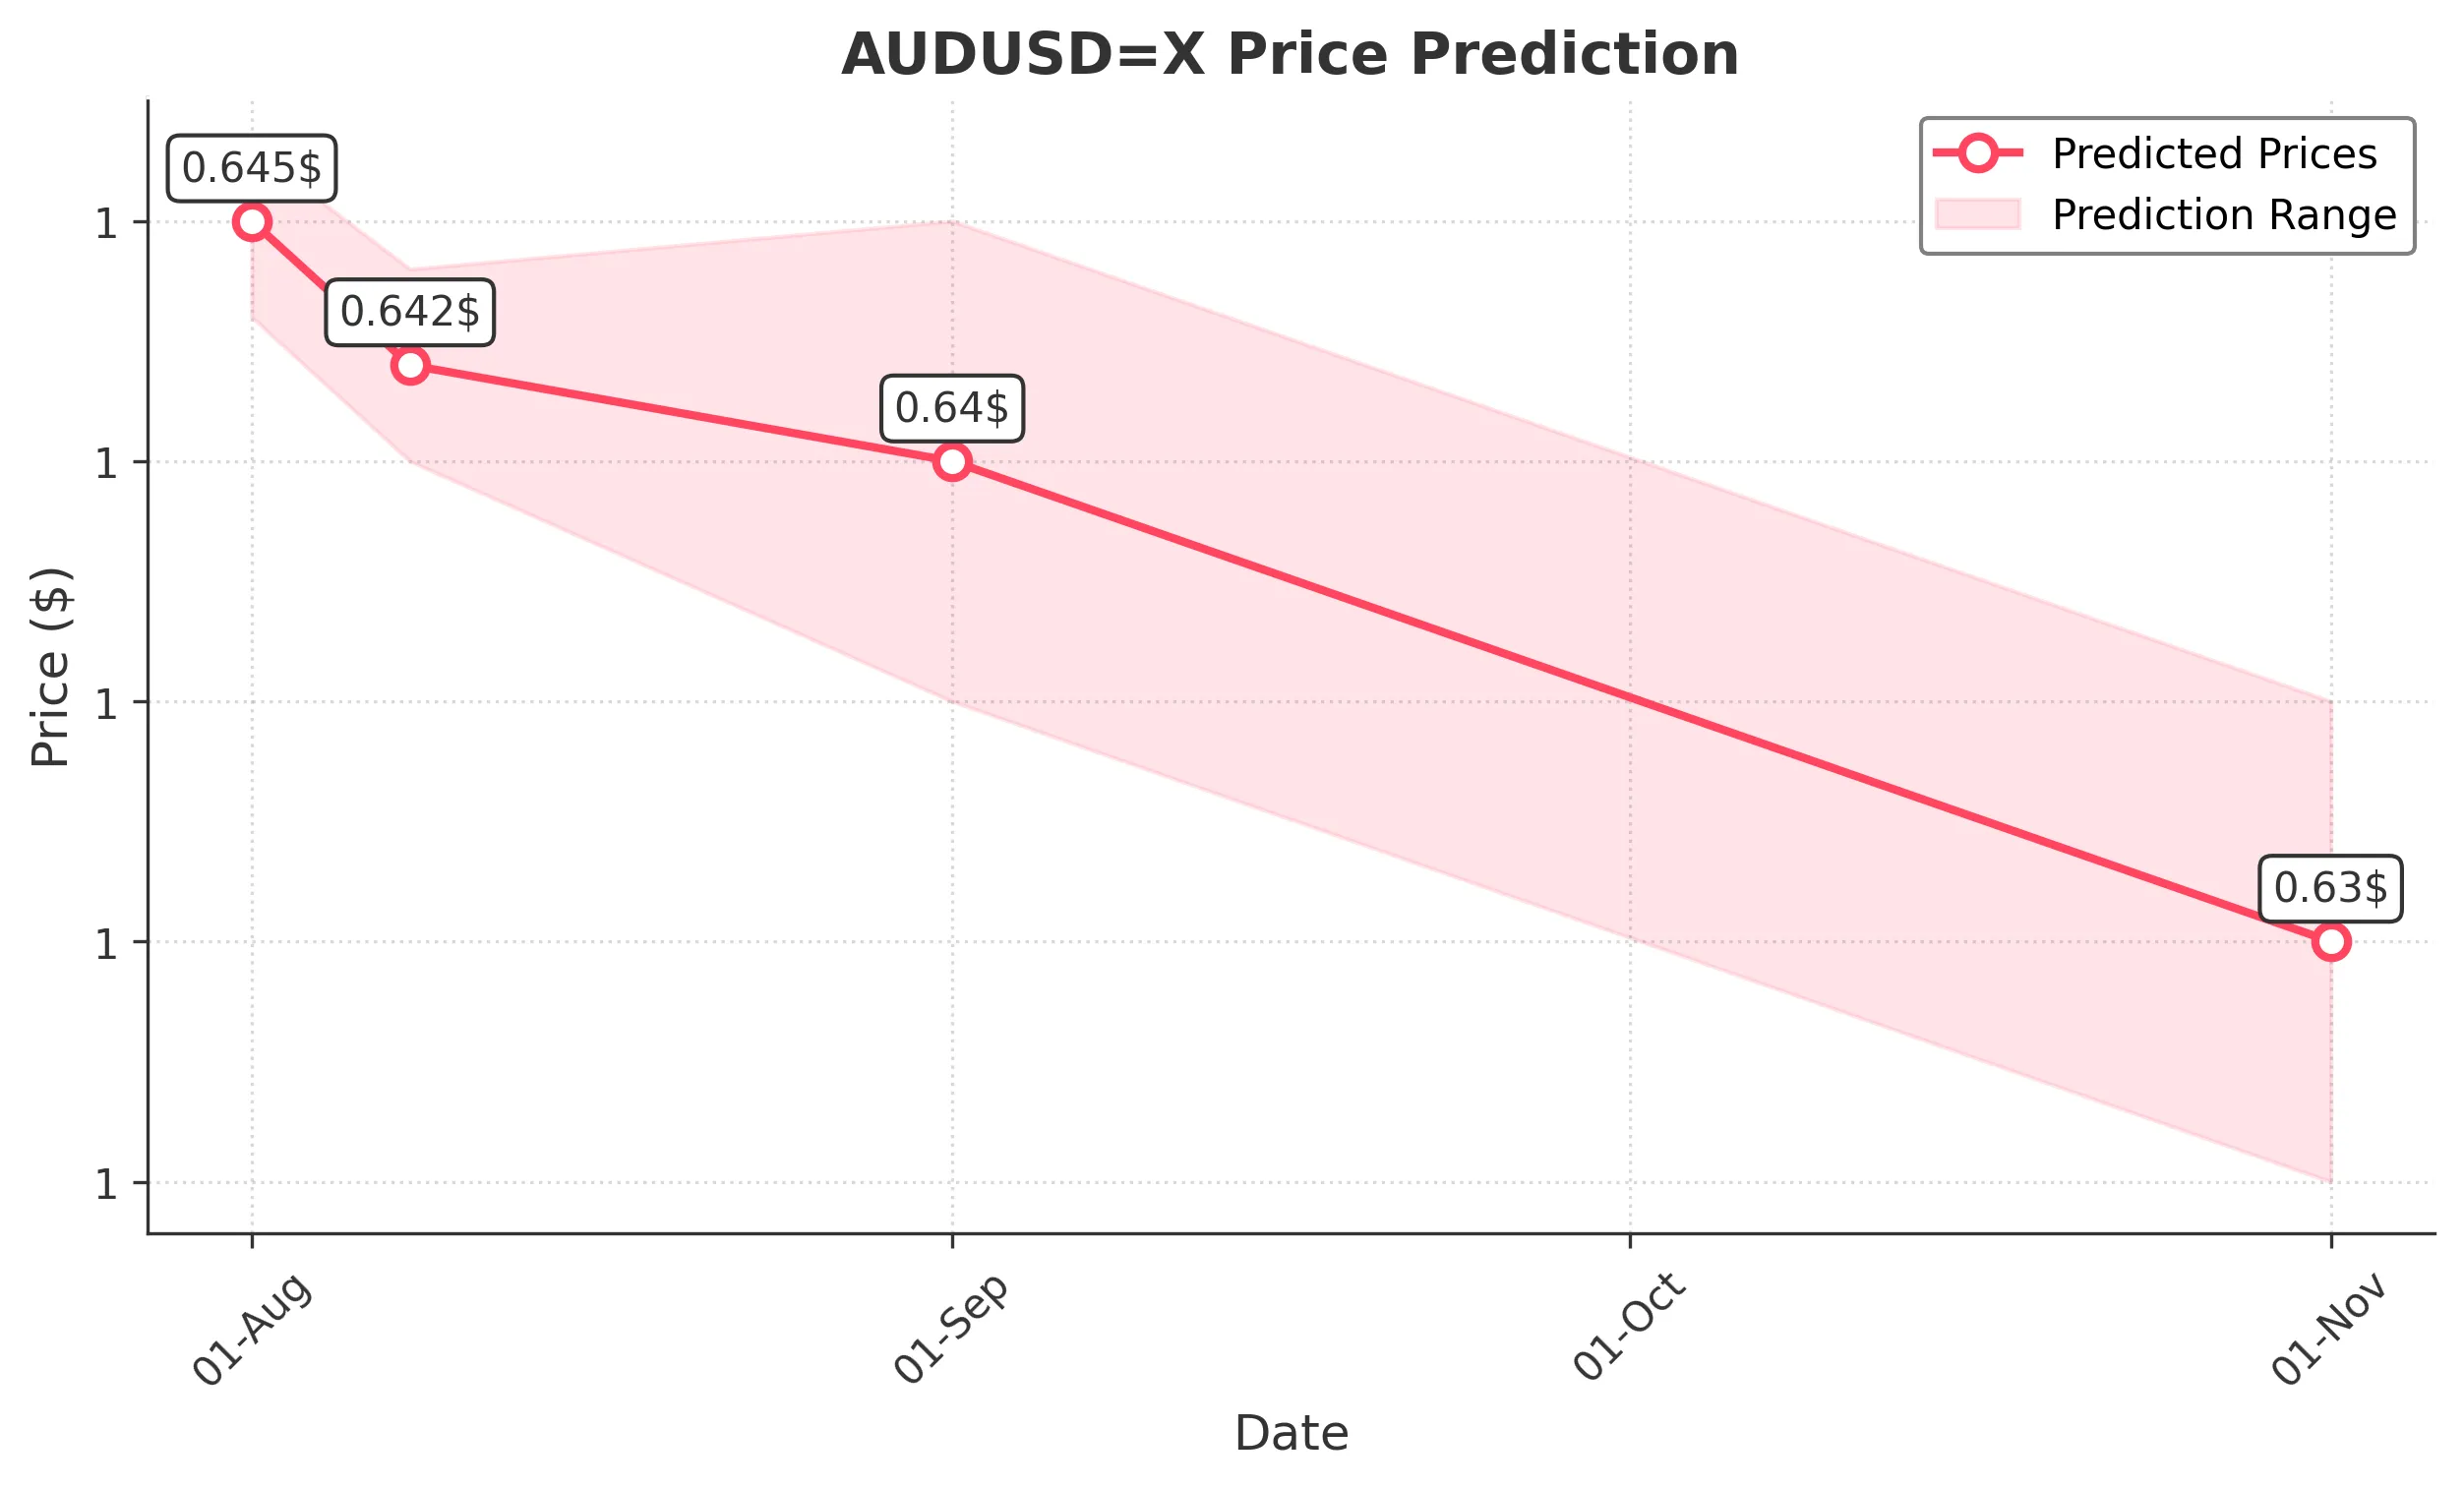
Target: August 1, 2025$0.645
$0.6445
$0.6465
$0.643
Description
The recent bearish trend indicated by the last few days' closes suggests a potential drop. RSI is nearing oversold levels, and MACD shows a bearish crossover. Expect a slight recovery but overall weakness.
Analysis
The past three months show a bearish trend with significant resistance around 0.6600. Recent candlestick patterns indicate indecision, and volume has been declining, suggesting a lack of strong buying interest.
Confidence Level
Potential Risks
Market volatility and external economic news could impact this prediction significantly.
1 Week Prediction
Target: August 8, 2025$0.642
$0.644
$0.644
$0.64
Description
Continued bearish momentum is expected as the market reacts to recent economic data. The Bollinger Bands are tightening, indicating potential volatility. A break below support at 0.6400 could lead to further declines.
Analysis
The stock has shown a bearish trend with key support at 0.6400. The RSI indicates potential oversold conditions, but the overall sentiment remains cautious. Volume patterns suggest a lack of strong buying pressure.
Confidence Level
Potential Risks
Unforeseen macroeconomic events could lead to sudden price movements.
1 Month Prediction
Target: September 1, 2025$0.64
$0.642
$0.645
$0.635
Description
Expect further declines as bearish sentiment persists. The Fibonacci retracement levels suggest a target around 0.6400. The market may react to upcoming economic reports, which could exacerbate downward pressure.
Analysis
The overall trend is bearish, with significant resistance at 0.6500. Recent candlestick patterns show bearish engulfing formations, and volume has been low, indicating weak buying interest. The market sentiment is cautious.
Confidence Level
Potential Risks
Economic indicators and geopolitical events could lead to unexpected volatility.
3 Months Prediction
Target: November 1, 2025$0.63
$0.632
$0.635
$0.625
Description
Long-term bearish outlook as economic conditions may worsen. The MACD indicates a strong bearish trend, and the RSI suggests oversold conditions. A break below 0.6300 could lead to further declines.
Analysis
The stock has been in a bearish trend with significant support at 0.6300. The overall market sentiment is negative, and recent economic data has not supported a bullish reversal. Volume patterns indicate a lack of strong buying interest.
Confidence Level
Potential Risks
Potential for market recovery exists, depending on economic developments and central bank policies.