BTC-USD Trading Predictions
1 Day Prediction
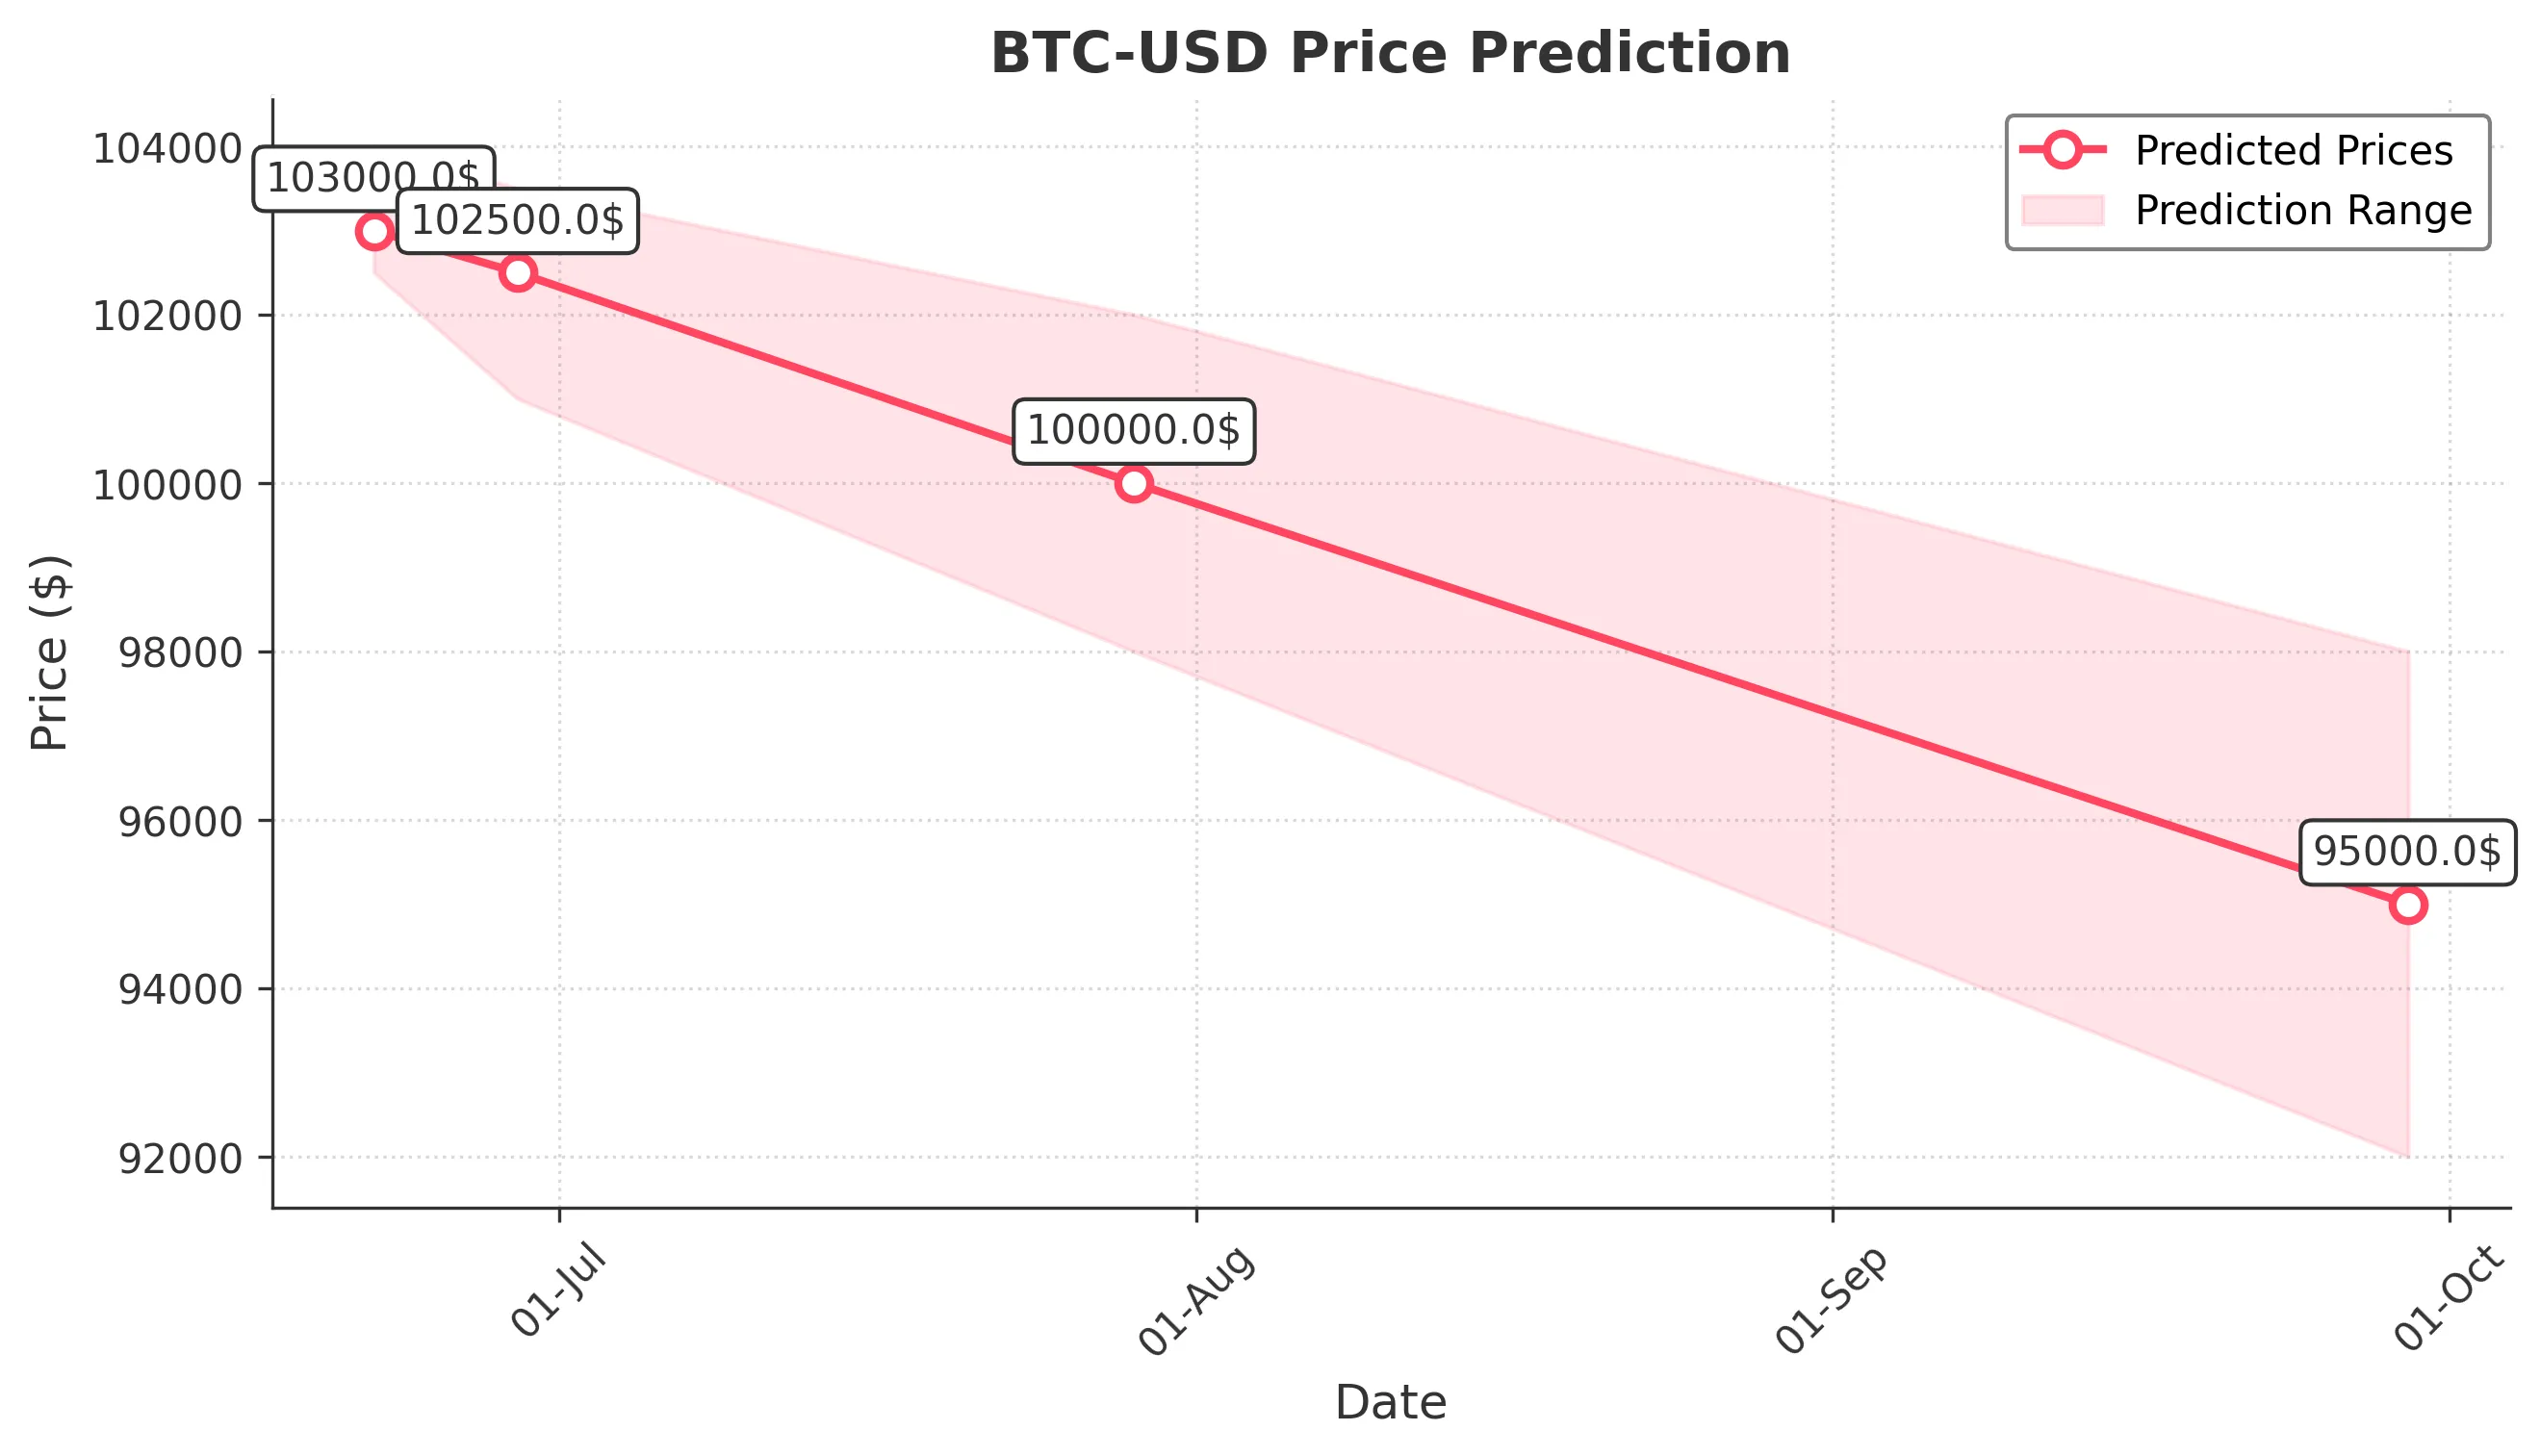
Target: June 22, 2025$103000
$103500
$104000
$102500
Description
The price is expected to stabilize around 103,000 due to recent bullish momentum, but potential resistance at 104,000 may limit upside. RSI indicates overbought conditions, suggesting a possible pullback.
Analysis
The past 3 months show a bullish trend with significant price increases, especially in May. Key resistance at 110,000 and support around 100,000. RSI is high, indicating potential overbought conditions.
Confidence Level
Potential Risks
Market volatility and external news could impact price movements significantly.
1 Week Prediction
Target: June 29, 2025$102500
$102000
$103500
$101000
Description
A slight decline is anticipated as profit-taking may occur after recent highs. The MACD shows a bearish crossover, indicating potential downward pressure.
Analysis
The market has shown strong bullish behavior, but recent candlestick patterns suggest a potential reversal. Volume spikes indicate profit-taking, and support levels are being tested.
Confidence Level
Potential Risks
Unforeseen macroeconomic events could lead to increased volatility.
1 Month Prediction
Target: July 29, 2025$100000
$101000
$102000
$98000
Description
A continued bearish trend is expected as market sentiment shifts. Fibonacci retracement levels suggest support around 100,000, but bearish indicators may push prices lower.
Analysis
The overall trend has been bullish, but recent price action shows signs of exhaustion. Key support at 100,000 is critical, and a break below could lead to further declines.
Confidence Level
Potential Risks
Market sentiment can change rapidly, and external factors may influence price direction.
3 Months Prediction
Target: September 29, 2025$95000
$94000
$98000
$92000
Description
A bearish outlook is anticipated as the market may face headwinds from regulatory news and profit-taking. The ATR indicates increasing volatility, suggesting potential price swings.
Analysis
The market has shown strong bullish trends, but signs of reversal are emerging. Key resistance levels are being tested, and external factors could lead to increased volatility.
Confidence Level
Potential Risks
Regulatory changes and macroeconomic factors could significantly impact market dynamics.