BTC-USD Trading Predictions
1 Day Prediction
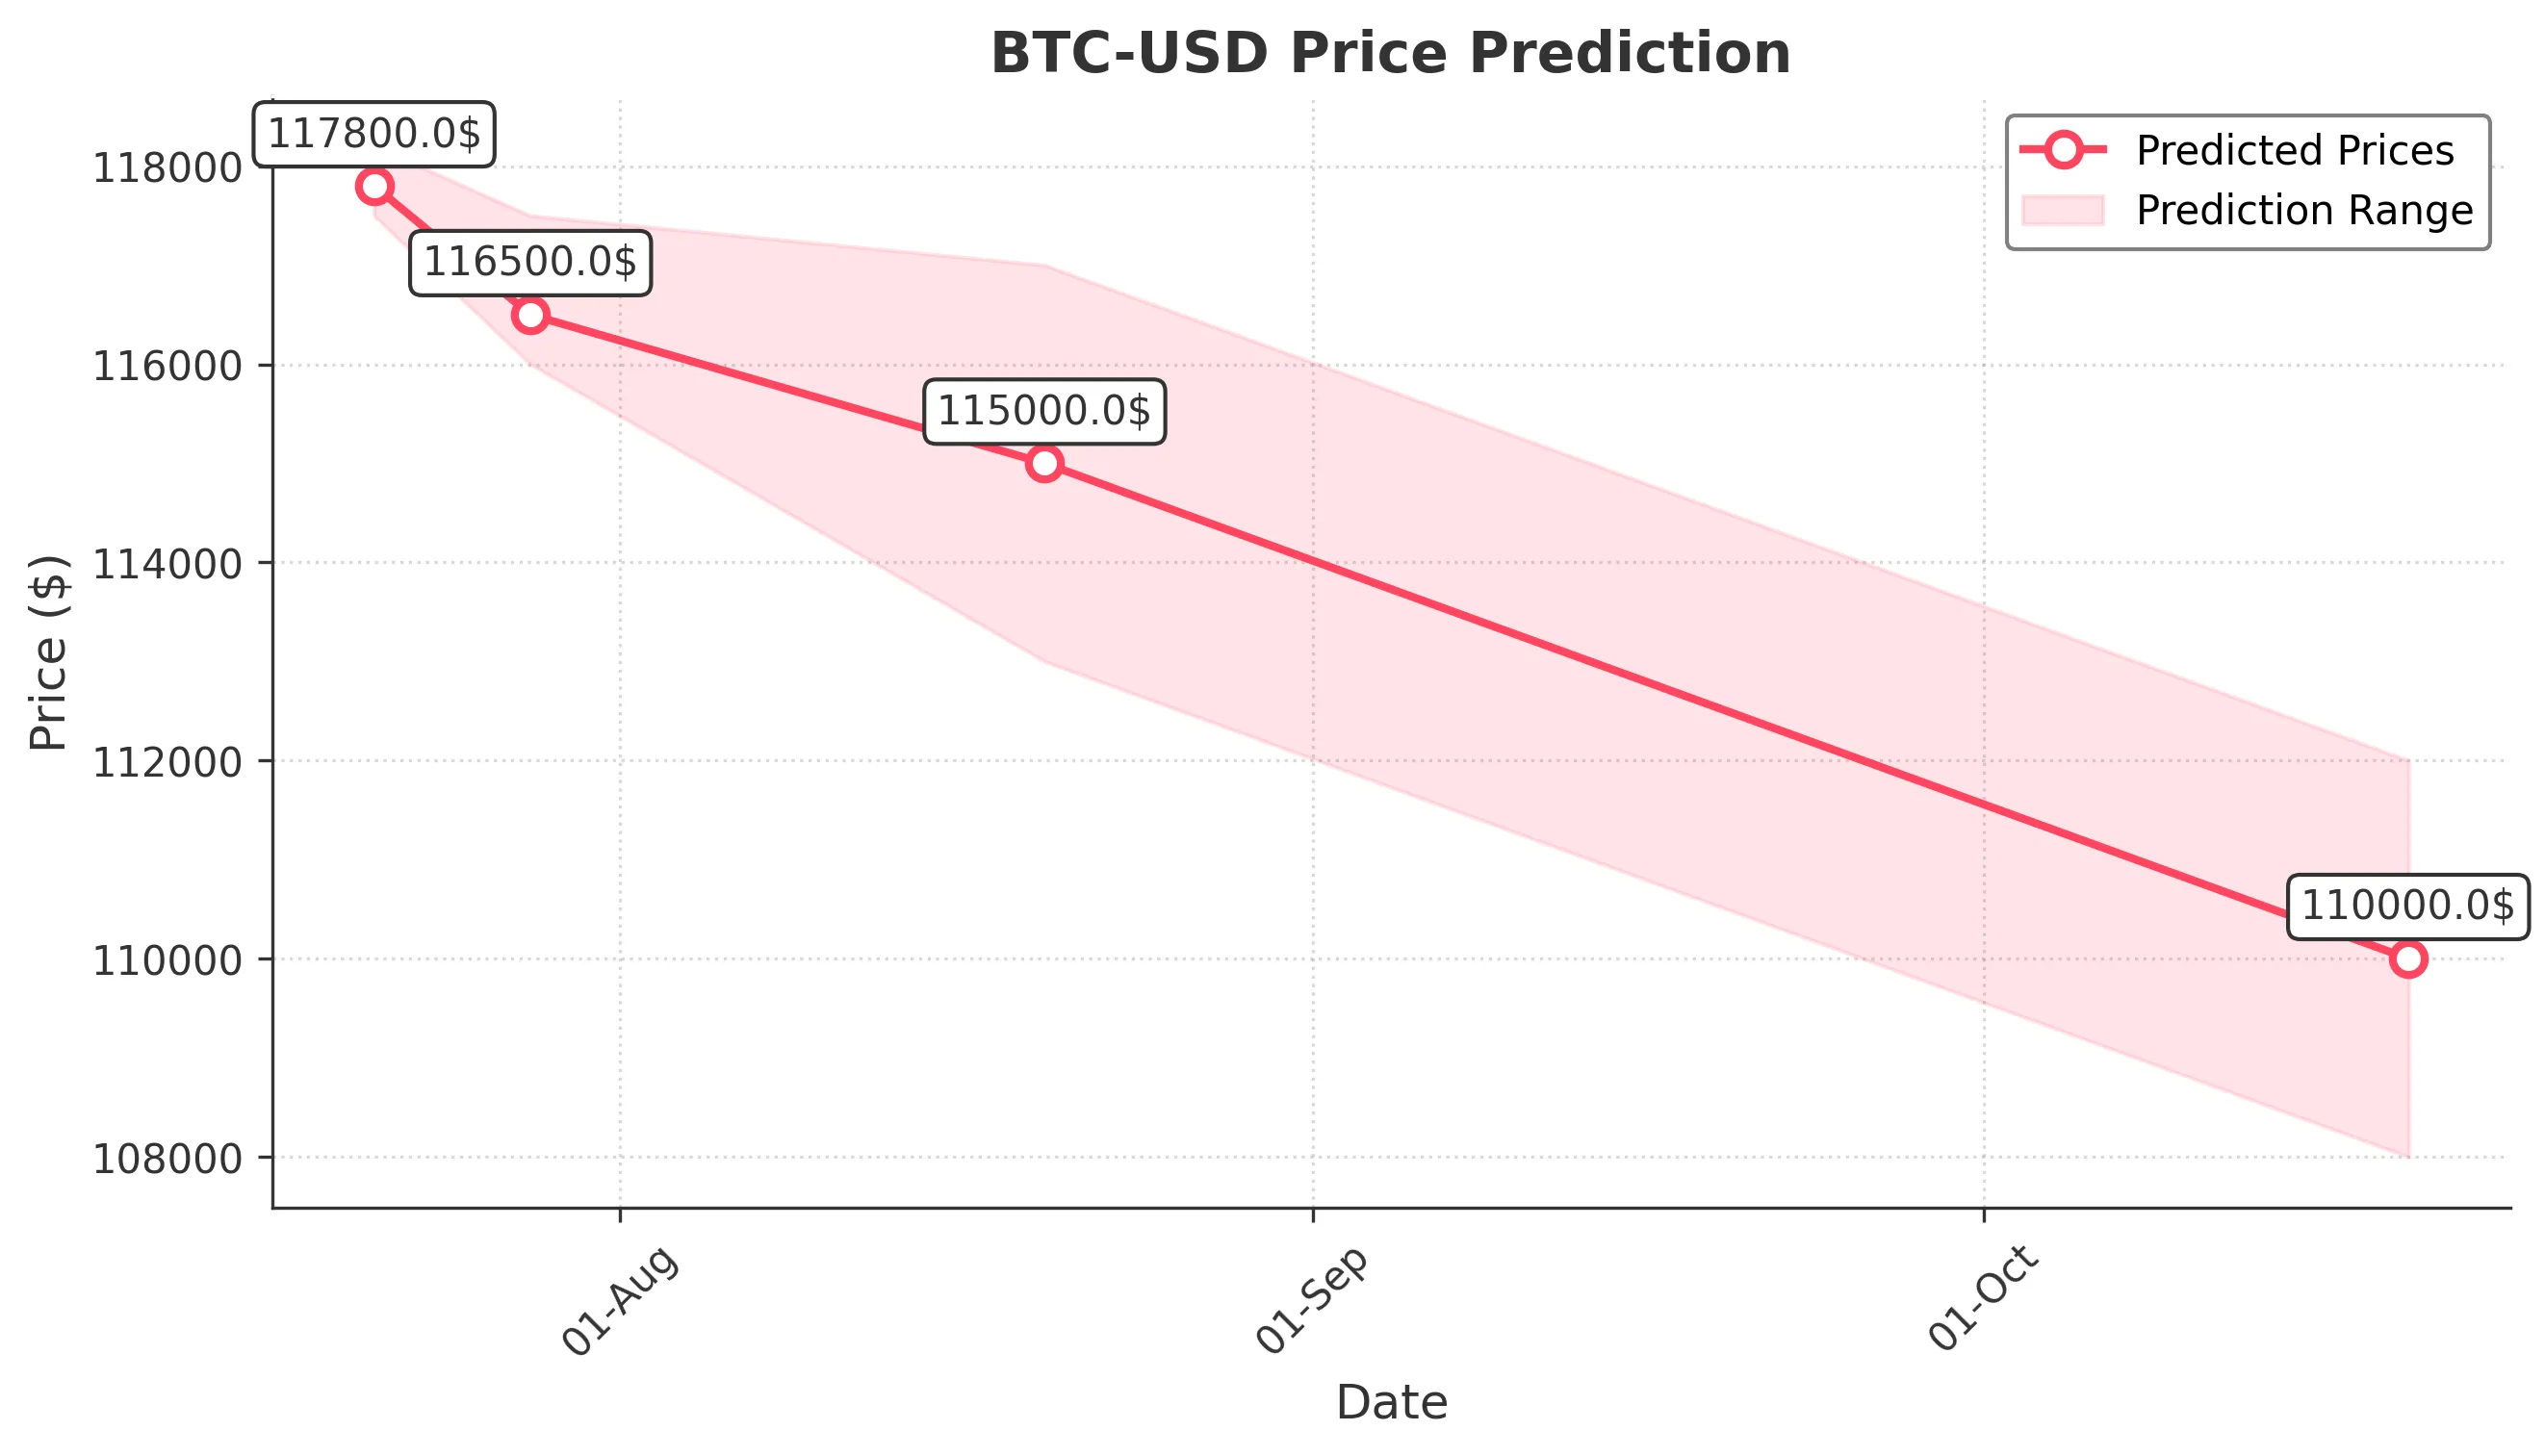
Target: July 21, 2025$117800
$117900
$118200
$117500
Description
The price is expected to stabilize around 117800, supported by recent bullish momentum. The RSI indicates overbought conditions, suggesting a potential pullback. However, strong volume suggests continued interest.
Analysis
The past 3 months show a bullish trend with significant upward movement. Key resistance at 120000 and support around 115000. Volume spikes indicate strong buying interest, but RSI suggests caution.
Confidence Level
Potential Risks
Potential for a reversal exists due to overbought RSI levels and recent volatility.
1 Week Prediction
Target: July 28, 2025$116500
$117000
$117500
$116000
Description
A slight decline to 116500 is anticipated as profit-taking may occur. The MACD shows a bearish crossover, indicating potential downward pressure. However, support at 115000 may hold.
Analysis
The bullish trend is showing signs of fatigue. Key support at 115000 is critical. The MACD and RSI suggest a potential correction, while volume remains strong, indicating ongoing interest.
Confidence Level
Potential Risks
Market sentiment could shift rapidly, and external news may impact price movements.
1 Month Prediction
Target: August 20, 2025$115000
$116000
$117000
$113000
Description
A further decline to 115000 is expected as bearish signals strengthen. The Bollinger Bands indicate potential for a breakout to the downside, and the ATR suggests increasing volatility.
Analysis
The market shows signs of a bearish trend with key resistance at 120000. Volume patterns indicate profit-taking, and the RSI is approaching oversold territory, suggesting a potential bounce back.
Confidence Level
Potential Risks
Unforeseen macroeconomic events could alter the trajectory significantly.
3 Months Prediction
Target: October 20, 2025$110000
$111000
$112000
$108000
Description
A decline to 110000 is projected as the market adjusts to previous highs. The Fibonacci retracement levels suggest a potential support at this price, but bearish sentiment may prevail.
Analysis
The overall trend appears to be shifting bearish. Key support at 110000 is critical, with potential for further declines if bearish sentiment continues. Volume analysis shows signs of weakening interest.
Confidence Level
Potential Risks
Market volatility and external factors could lead to unexpected price movements.