BTC-USD Trading Predictions
1 Day Prediction
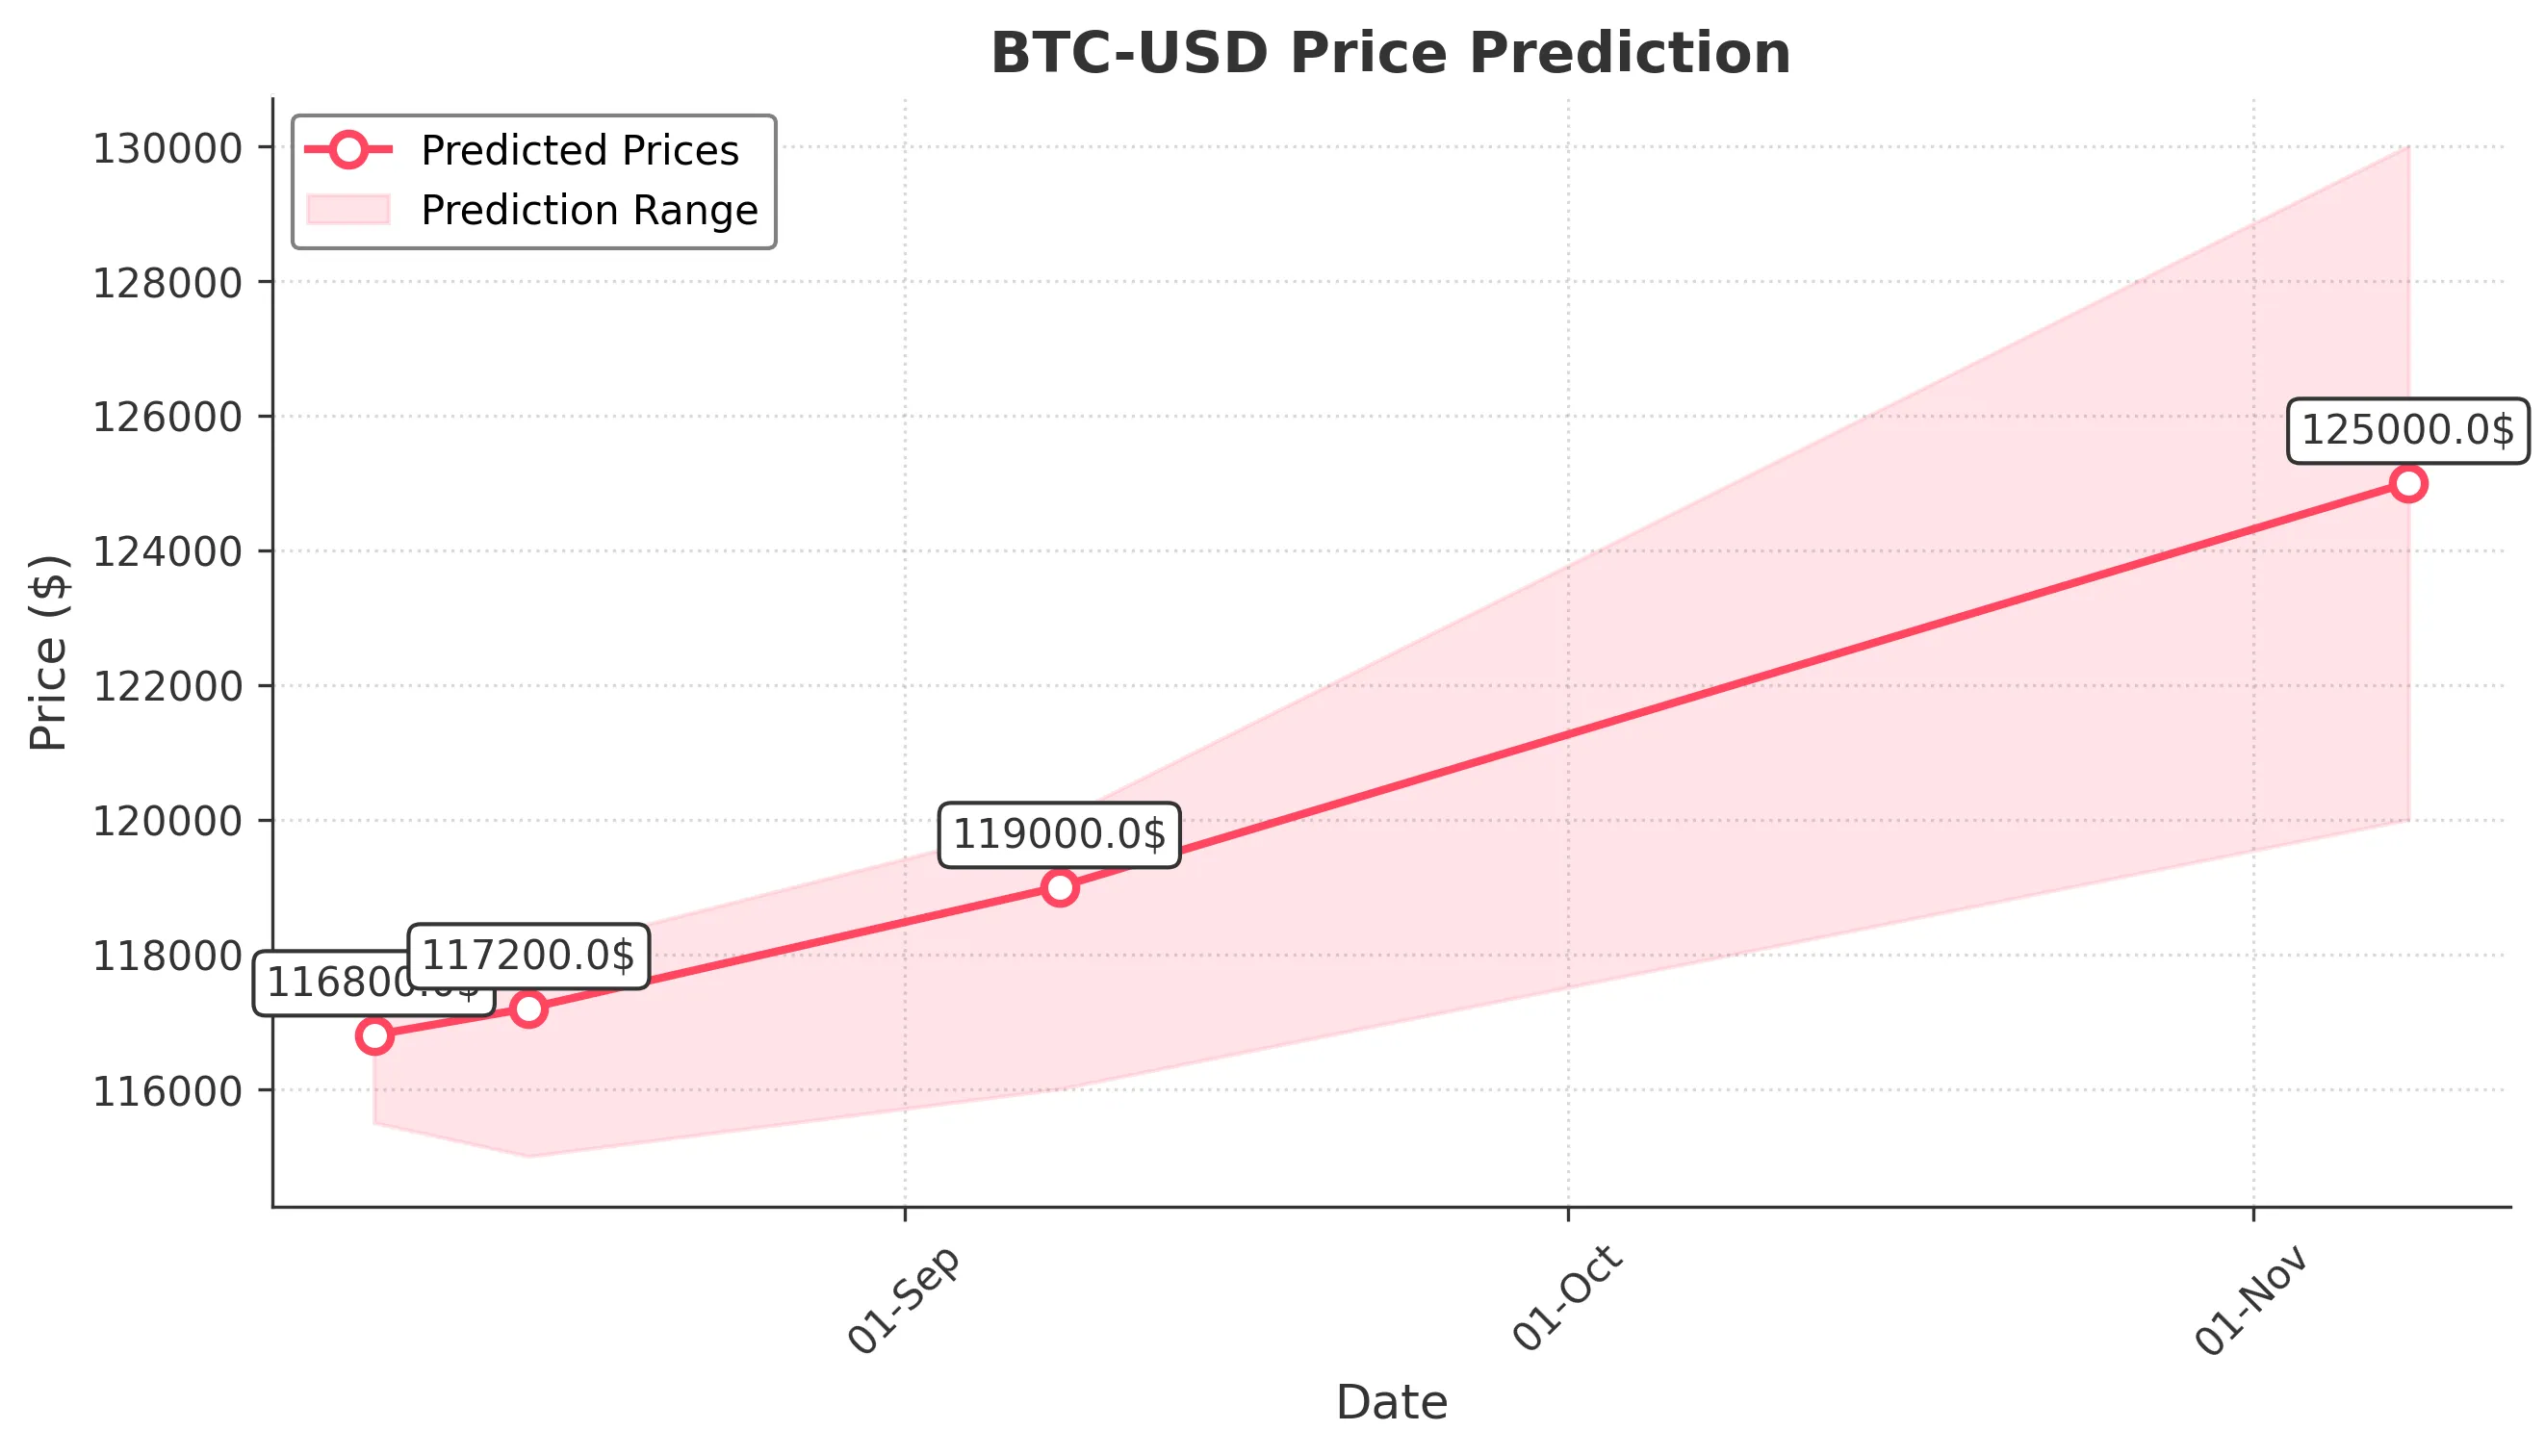
Target: August 8, 2025$116800
$116500
$117500
$115500
Description
The price is expected to rise slightly due to bullish momentum from recent candlestick patterns and a strong RSI. However, resistance at 117500 may limit gains.
Analysis
The past 3 months show a bullish trend with significant upward movements. Key support is at 115000, while resistance is around 117500. RSI indicates overbought conditions, suggesting caution.
Confidence Level
Potential Risks
Potential volatility due to market sentiment shifts or macroeconomic news could impact the prediction.
1 Week Prediction
Target: August 15, 2025$117200
$116800
$118000
$115000
Description
Continued bullish sentiment is expected, but the market may face resistance at 118000. Volume trends suggest strong interest, but overbought conditions could lead to a pullback.
Analysis
The stock has shown strong upward momentum, with key support at 115000. The MACD indicates bullish momentum, but the RSI suggests potential overbought conditions, warranting caution.
Confidence Level
Potential Risks
Market corrections or negative news could reverse the upward trend, impacting the accuracy of this prediction.
1 Month Prediction
Target: September 8, 2025$119000
$117500
$120000
$116000
Description
A bullish trend is anticipated as the market continues to gain momentum. However, resistance at 120000 may pose challenges. Volume analysis indicates sustained interest.
Analysis
The overall trend remains bullish, with significant upward movements. Key support is at 116000, while resistance is at 120000. The ATR indicates increasing volatility, suggesting potential price swings.
Confidence Level
Potential Risks
Market volatility and external economic factors could lead to unexpected price movements, affecting the prediction's reliability.
3 Months Prediction
Target: November 8, 2025$125000
$123000
$130000
$120000
Description
Long-term bullish sentiment is expected, driven by strong market fundamentals. However, potential resistance at 130000 may limit gains. Watch for volume spikes indicating market interest.
Analysis
The stock has shown a strong bullish trend over the past months, with key support at 120000. The MACD and RSI indicate bullish momentum, but potential resistance at 130000 could lead to corrections.
Confidence Level
Potential Risks
Unforeseen macroeconomic events or regulatory changes could significantly impact the market, leading to volatility.