BTC-USD Trading Predictions
1 Day Prediction
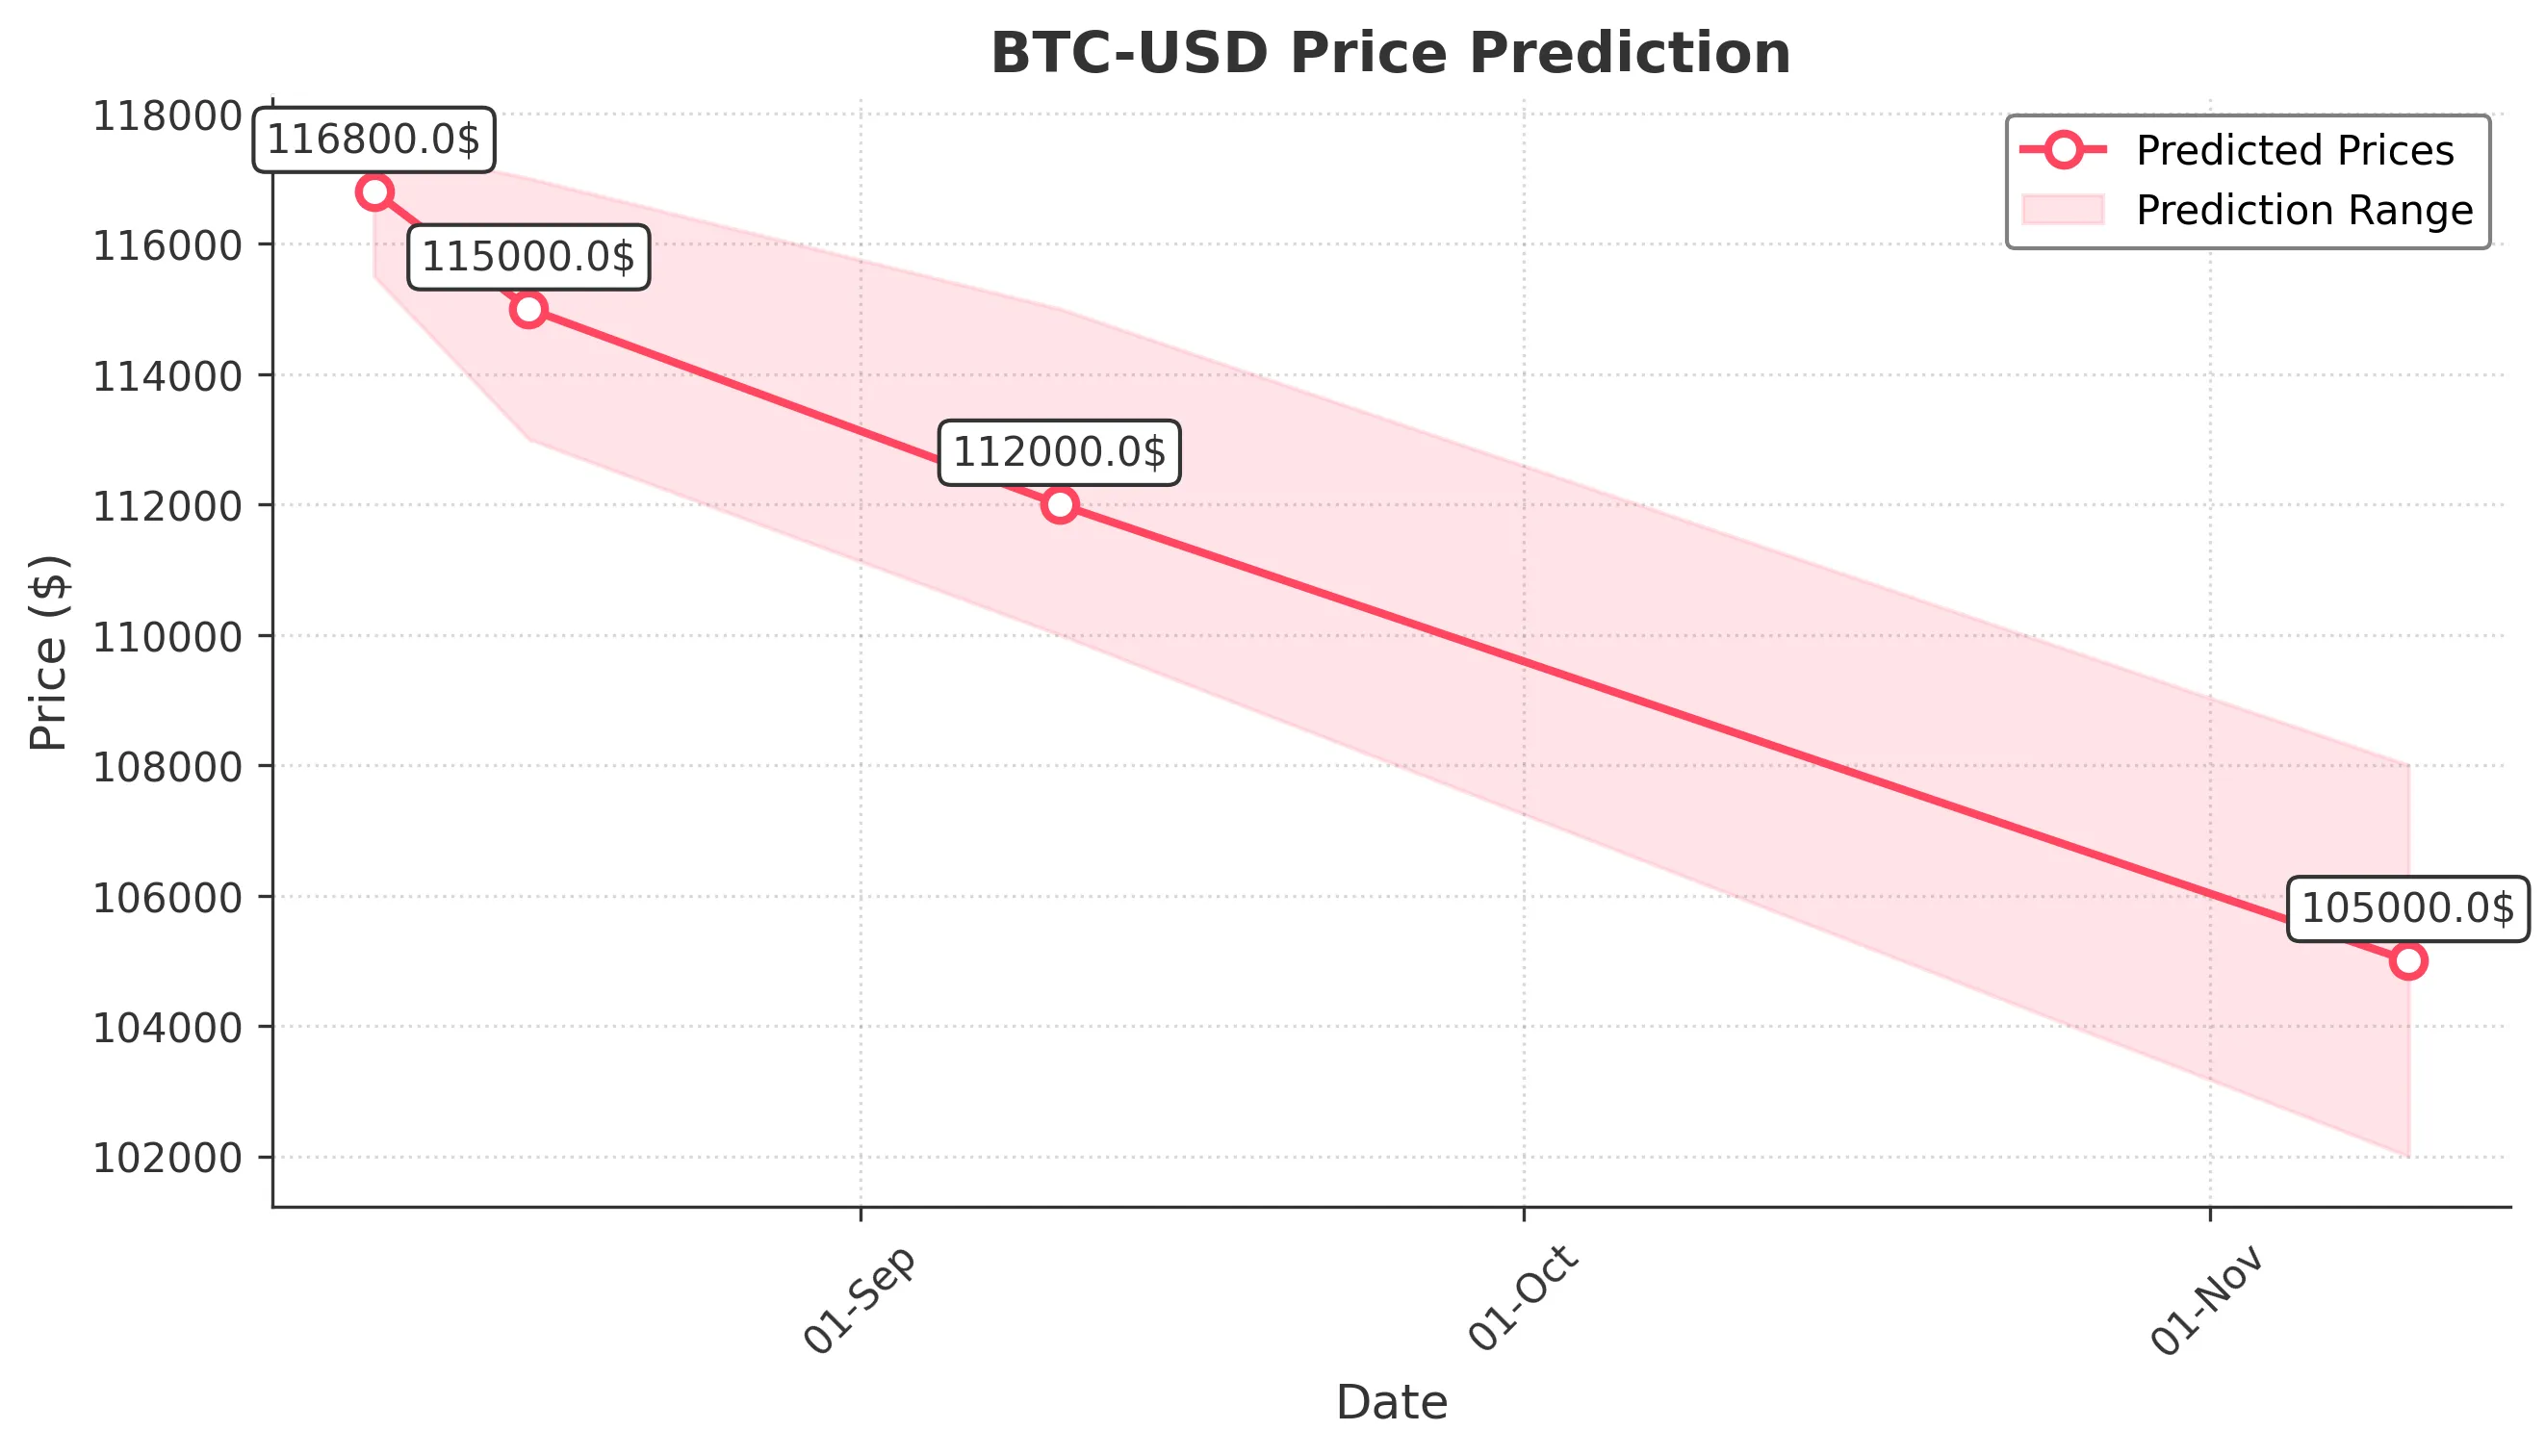
Target: August 10, 2025$116800
$116600
$117500
$115500
Description
The price is expected to stabilize around 116800, supported by recent bullish momentum and a strong RSI indicating overbought conditions. However, a potential pullback is possible due to profit-taking.
Analysis
The past 3 months show a bullish trend with significant upward movements. Key resistance at 117500 and support around 115500. RSI indicates overbought conditions, suggesting a possible correction.
Confidence Level
Potential Risks
Market volatility and external news could impact the price significantly.
1 Week Prediction
Target: August 17, 2025$115000
$116800
$117000
$113000
Description
A slight decline to 115000 is anticipated as profit-taking may increase. The MACD shows a bearish crossover, indicating potential downward pressure in the coming week.
Analysis
The market has shown strong bullish activity, but recent candlestick patterns suggest a potential reversal. Key support at 113000 may hold, but a break could lead to further declines.
Confidence Level
Potential Risks
Unexpected market news or changes in sentiment could lead to volatility.
1 Month Prediction
Target: September 10, 2025$112000
$115000
$115000
$110000
Description
A continued bearish trend is expected, with a target close of 112000. The Bollinger Bands indicate potential for further downside as the price approaches the lower band.
Analysis
The overall trend is shifting bearish, with significant resistance at 115000. Volume has been increasing on down days, indicating selling pressure. Key support at 110000 is critical.
Confidence Level
Potential Risks
Market sentiment can shift rapidly, and macroeconomic factors may influence price movements.
3 Months Prediction
Target: November 10, 2025$105000
$110000
$108000
$102000
Description
A further decline to 105000 is projected as bearish sentiment prevails. The Fibonacci retracement levels suggest a strong support at 102000, which may be tested.
Analysis
The market shows signs of a bearish trend with significant resistance at 110000. The ATR indicates increasing volatility, and external factors could heavily influence price movements.
Confidence Level
Potential Risks
Long-term predictions are uncertain due to potential market recovery or external economic factors.