BTC-USD Trading Predictions
1 Day Prediction
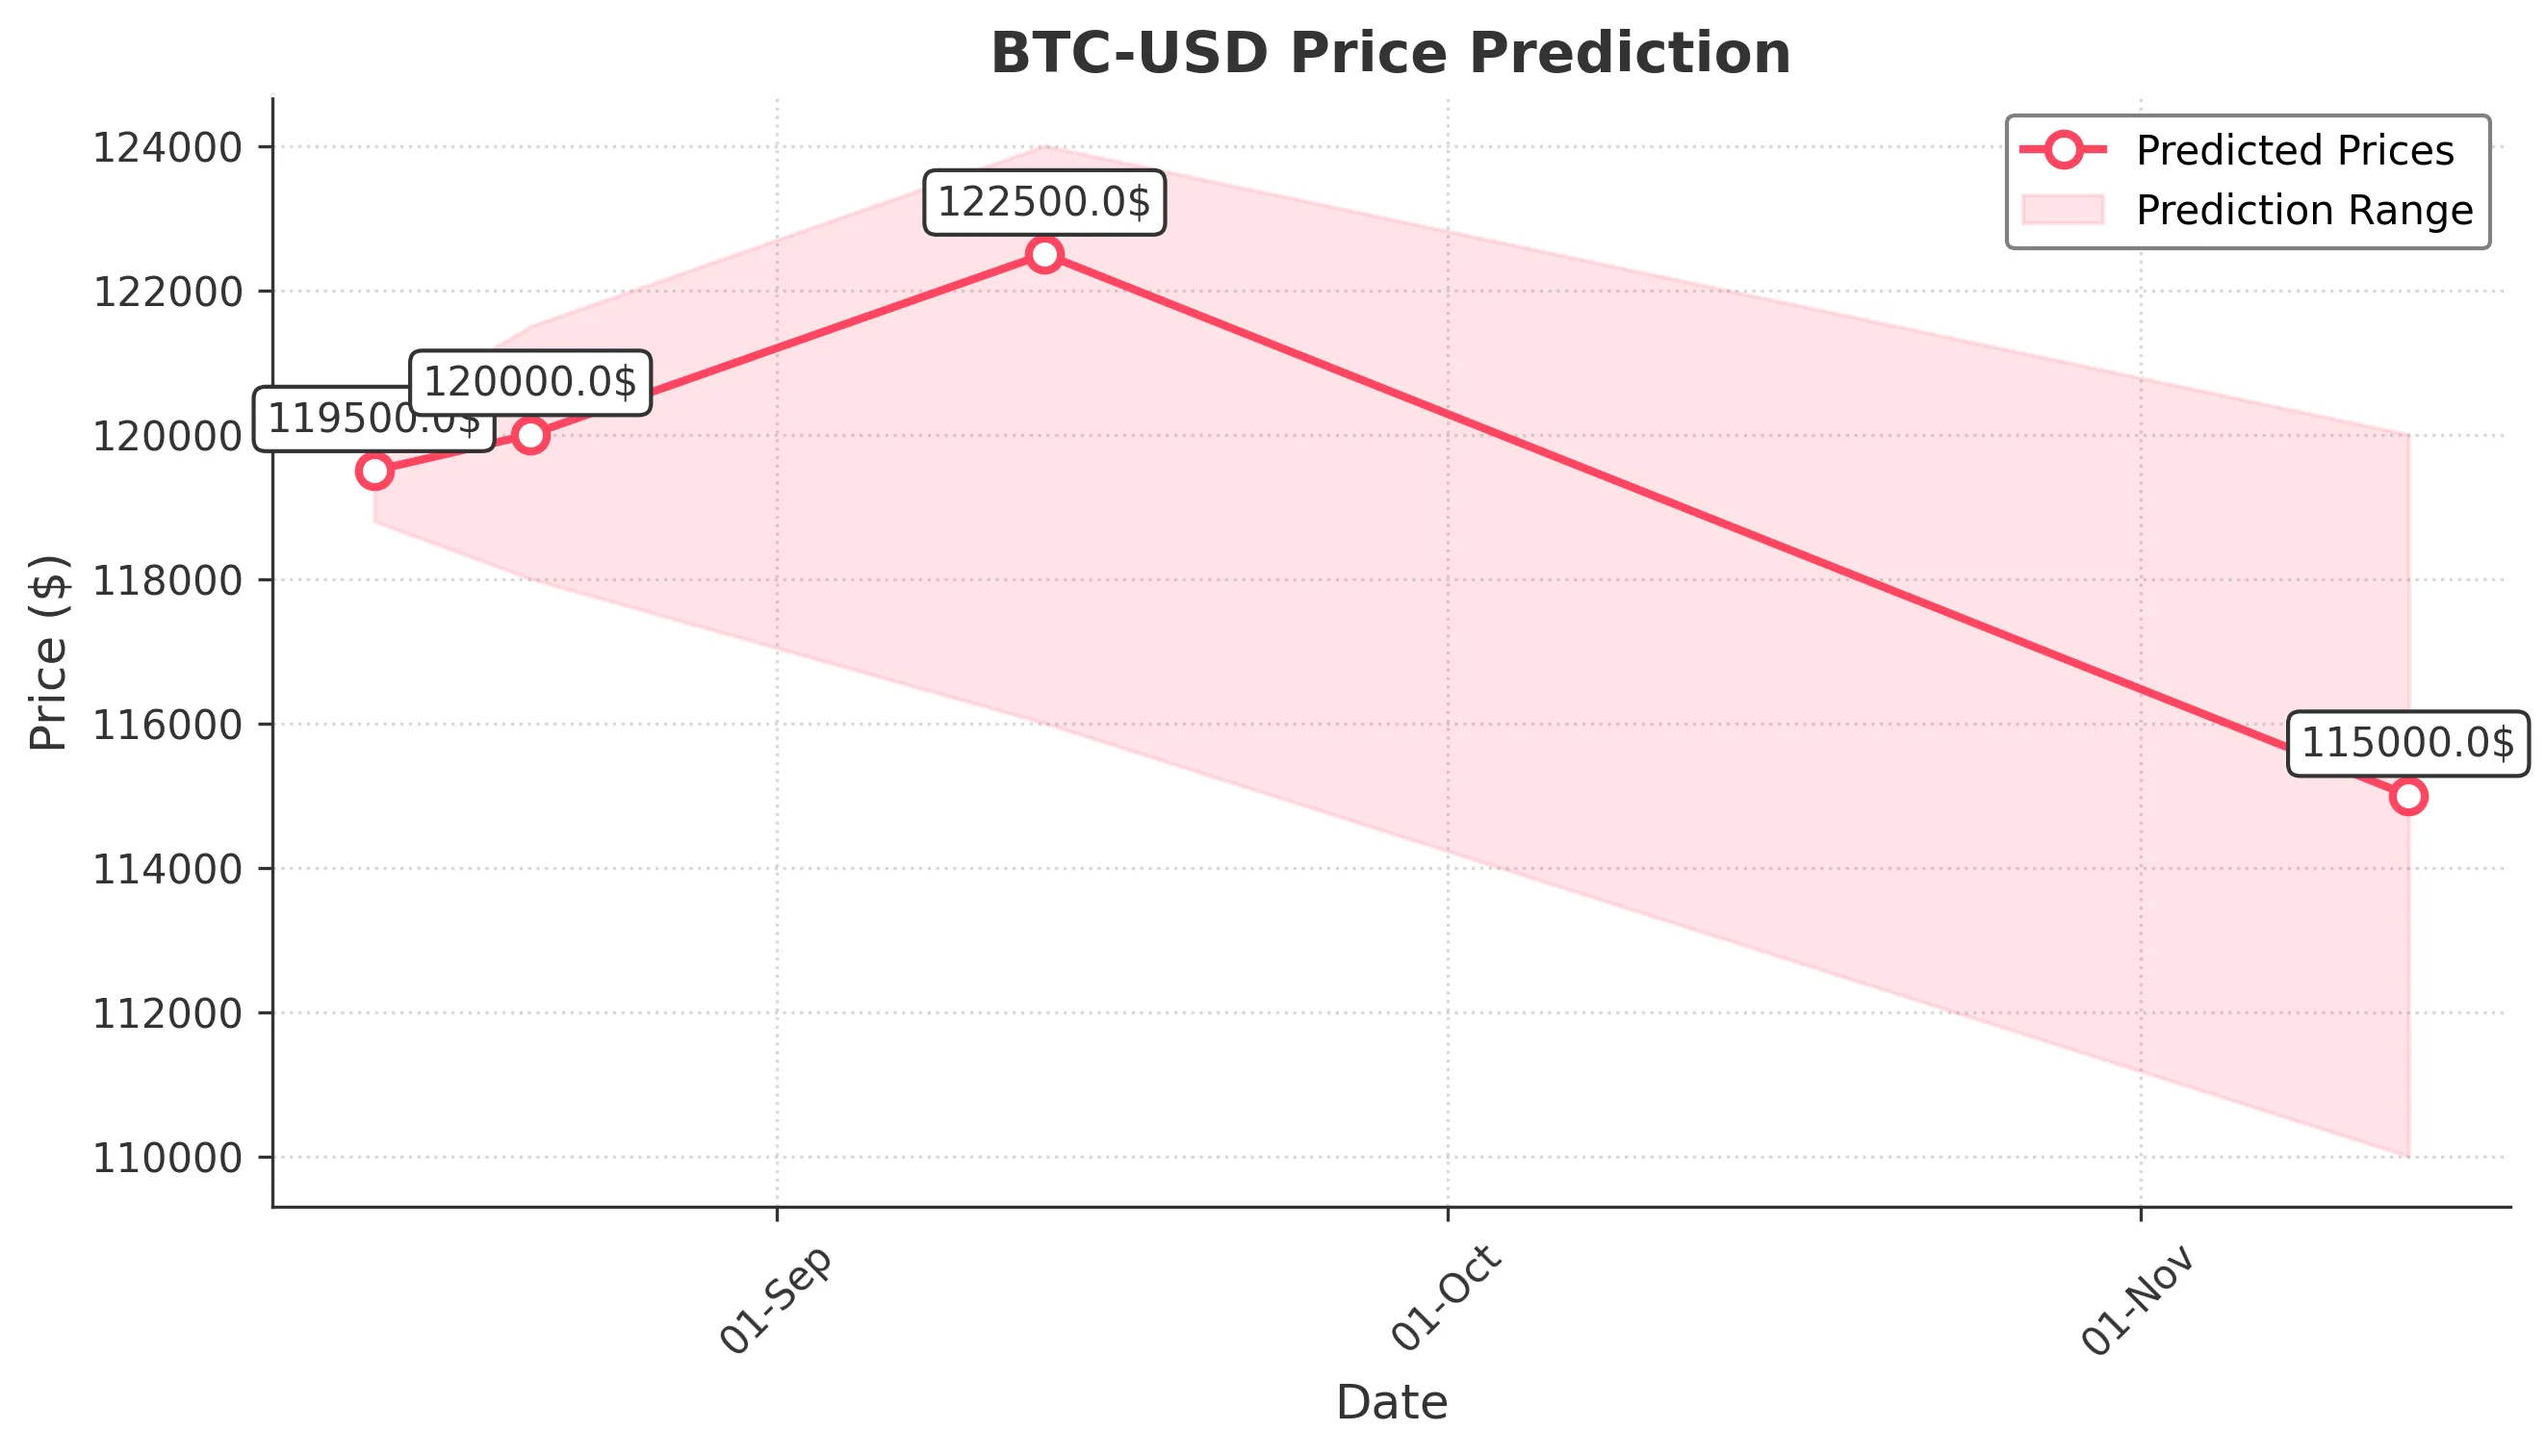
Target: August 14, 2025$119500
$119200
$120200
$118800
Description
The price is expected to rise slightly due to bullish momentum from recent candlestick patterns and strong volume. The RSI indicates overbought conditions, suggesting a potential pullback, but overall sentiment remains positive.
Analysis
The past 3 months show a bullish trend with significant upward movements. Key resistance at 120000 and support around 115000. RSI is nearing overbought levels, indicating caution. Volume spikes suggest strong interest, but volatility remains a concern.
Confidence Level
Potential Risks
Potential for a reversal exists if market sentiment shifts or if external news impacts trading.
1 Week Prediction
Target: August 21, 2025$120000
$119500
$121500
$118000
Description
Expecting a slight increase as bullish sentiment continues. However, the MACD shows signs of divergence, indicating potential weakening momentum. Watch for volume trends to confirm direction.
Analysis
The trend remains bullish, with recent highs indicating strong buying interest. Support at 115000 holds firm, while resistance at 120000 is tested. The ATR suggests increasing volatility, which could impact price stability.
Confidence Level
Potential Risks
Market volatility and external factors could lead to unexpected price movements.
1 Month Prediction
Target: September 13, 2025$122500
$120000
$124000
$116000
Description
A bullish outlook as the market continues to show strength. Fibonacci retracement levels suggest potential for further gains, but watch for signs of exhaustion in buying pressure.
Analysis
The overall trend is bullish, with significant support at 115000 and resistance at 125000. The RSI indicates potential overbought conditions, and recent volume spikes suggest strong interest. However, caution is warranted as volatility increases.
Confidence Level
Potential Risks
Possible corrections if market sentiment shifts or if macroeconomic factors influence trading.
3 Months Prediction
Target: November 13, 2025$115000
$120000
$120000
$110000
Description
Expecting a potential pullback as the market may correct after a strong bullish run. The MACD shows signs of weakening momentum, and the RSI indicates overbought conditions.
Analysis
The past 3 months show a strong bullish trend, but signs of exhaustion are emerging. Key support at 110000 and resistance at 120000. The ATR indicates increasing volatility, suggesting potential for price swings. Market sentiment remains mixed.
Confidence Level
Potential Risks
Market corrections are common after strong rallies, and external economic factors could significantly impact prices.