BTC-USD Trading Predictions
1 Day Prediction
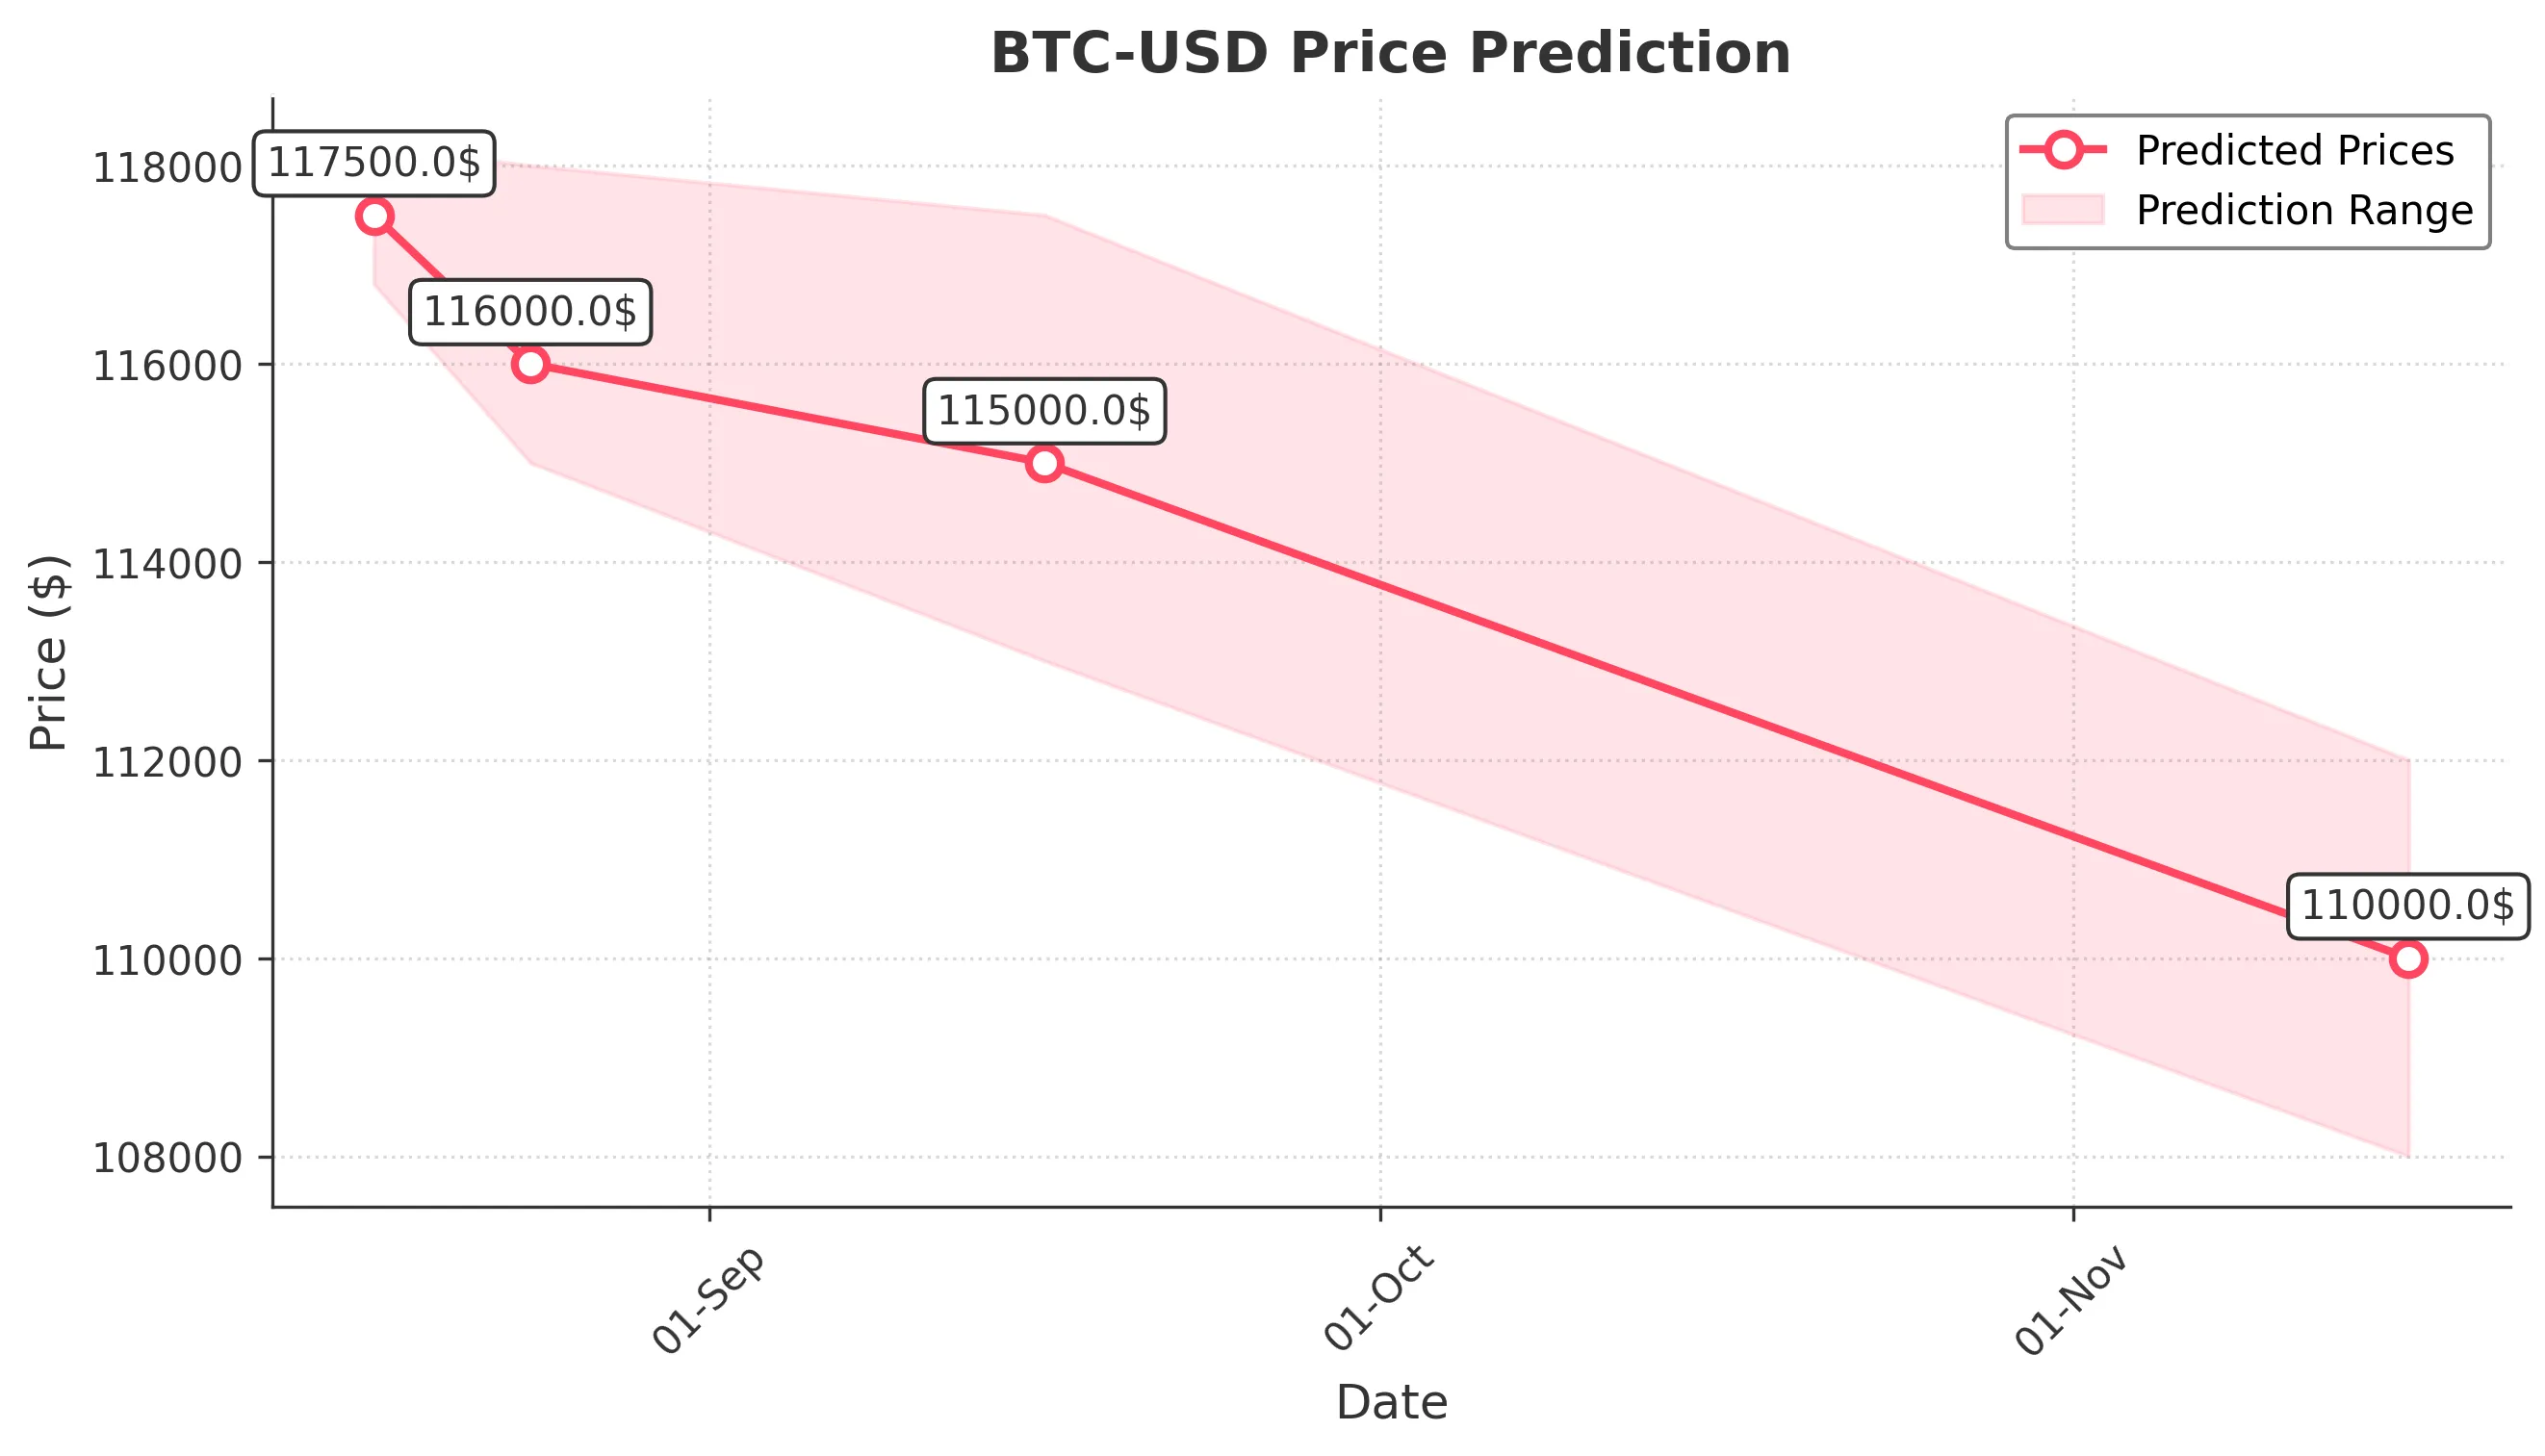
Target: August 17, 2025$117500
$117400
$118200
$116800
Description
The price is expected to stabilize around 117500, supported by recent bullish momentum and a strong RSI indicating overbought conditions. However, a potential pullback could occur due to profit-taking.
Analysis
The past 3 months show a bullish trend with significant upward movements. Key resistance at 120000 and support around 115000. RSI indicates overbought conditions, suggesting a possible correction.
Confidence Level
Potential Risks
Market volatility and profit-taking could lead to unexpected price movements.
1 Week Prediction
Target: August 24, 2025$116000
$117000
$118000
$115000
Description
A slight decline to 116000 is anticipated as the market may correct after recent highs. The MACD shows bearish divergence, indicating potential weakness in momentum.
Analysis
The market has shown strong bullish trends but is now facing resistance. Volume spikes suggest profit-taking, and the ATR indicates increasing volatility, which could lead to price fluctuations.
Confidence Level
Potential Risks
Unexpected news or macroeconomic events could impact market sentiment significantly.
1 Month Prediction
Target: September 16, 2025$115000
$116500
$117500
$113000
Description
A further decline to 115000 is expected as bearish signals from the RSI and MACD suggest weakening momentum. The market may test support levels around 113000.
Analysis
The overall trend is shifting towards bearish as recent highs are not being sustained. Key support at 113000 is critical, and the market is experiencing increased volatility.
Confidence Level
Potential Risks
Market sentiment could shift rapidly due to external factors, impacting the accuracy of this prediction.
3 Months Prediction
Target: November 16, 2025$110000
$111000
$112000
$108000
Description
A longer-term bearish trend is anticipated, with a potential drop to 110000 as macroeconomic factors and market sentiment weigh heavily. Support at 108000 may be tested.
Analysis
The market shows signs of a bearish reversal after a strong bullish phase. Key resistance levels are being tested, and the overall sentiment is cautious, with potential for further declines.
Confidence Level
Potential Risks
Unforeseen macroeconomic events or regulatory changes could drastically alter market conditions.