ETH-USD Trading Predictions
1 Day Prediction
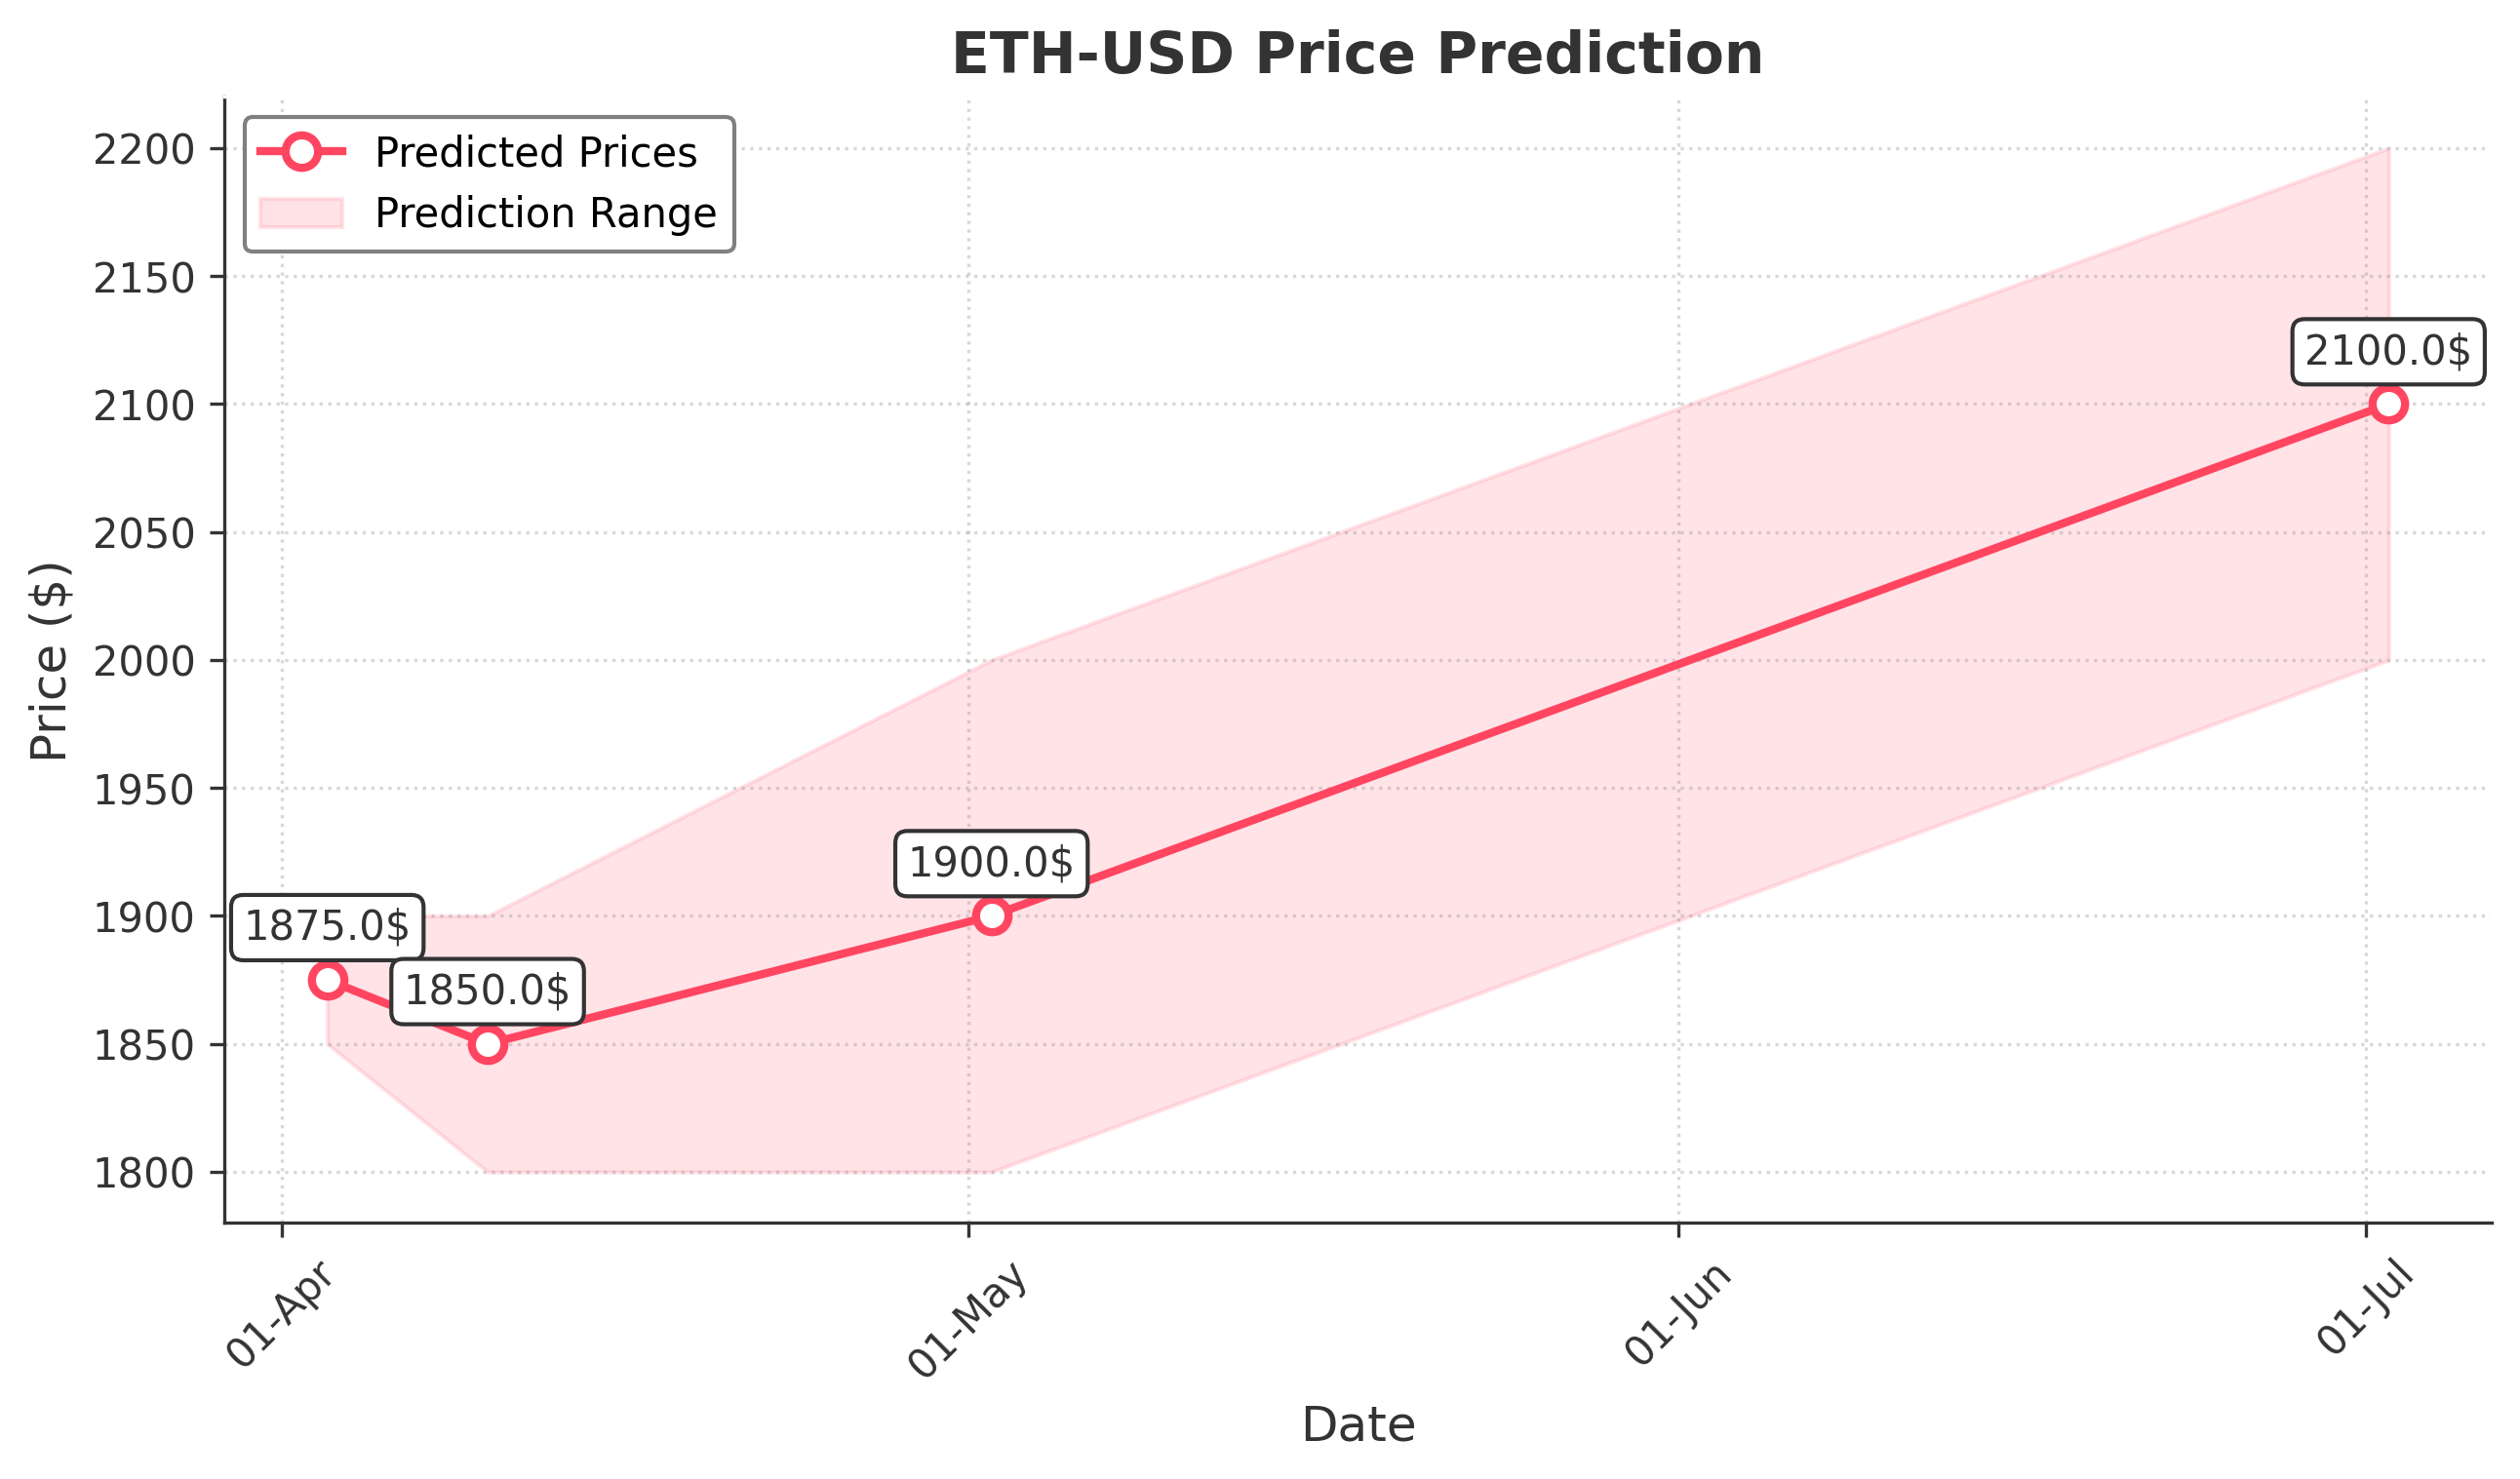
Target: April 3, 2025$1875
$1880
$1900
$1850
Description
The price is expected to decline slightly due to bearish momentum indicated by recent candlestick patterns and a drop in volume. The RSI is approaching oversold levels, suggesting potential for a short-term bounce, but overall sentiment remains weak.
Analysis
Over the past 3 months, ETH-USD has shown a bearish trend with significant fluctuations. Key support is around 1800, while resistance is near 2000. The MACD indicates a bearish crossover, and the ATR suggests increasing volatility. Volume has been inconsistent, with spikes during sell-offs.
Confidence Level
Potential Risks
Market volatility and external news could impact the price unexpectedly.
1 Week Prediction
Target: April 10, 2025$1850
$1870
$1900
$1800
Description
The bearish trend is expected to continue, with potential for a slight recovery mid-week. The Bollinger Bands indicate a squeeze, suggesting a breakout could occur, but the overall sentiment remains negative.
Analysis
ETH-USD has been in a downtrend, with significant resistance at 2000. The RSI is low, indicating potential for a bounce, but the overall market sentiment is bearish. Volume patterns show increased selling pressure, and candlestick formations suggest indecision.
Confidence Level
Potential Risks
Unforeseen macroeconomic events or regulatory news could lead to sudden price changes.
1 Month Prediction
Target: May 2, 2025$1900
$1850
$2000
$1800
Description
A potential recovery is anticipated as the market may stabilize. The Fibonacci retracement levels suggest support at 1800, and if the price can hold above this, a rally towards 2000 is possible. However, caution is advised due to ongoing bearish sentiment.
Analysis
The past three months have shown a bearish trend with significant volatility. Support at 1800 is critical, while resistance remains at 2000. The MACD is bearish, but the RSI indicates potential for a rebound. Volume has been inconsistent, reflecting market uncertainty.
Confidence Level
Potential Risks
Continued bearish sentiment and macroeconomic factors could hinder recovery.
3 Months Prediction
Target: July 2, 2025$2100
$2050
$2200
$2000
Description
If the market stabilizes, a gradual recovery towards 2100 is possible. The technical indicators suggest a potential reversal if the price can break above 2000. However, external factors could still pose risks.
Analysis
The overall trend has been bearish, with significant resistance at 2000. The market is currently in a consolidation phase, and any positive news could trigger a rally. However, the bearish MACD and low RSI indicate caution is warranted.
Confidence Level
Potential Risks
Market volatility and external economic conditions could significantly impact this prediction.