ETH-USD Trading Predictions
1 Day Prediction
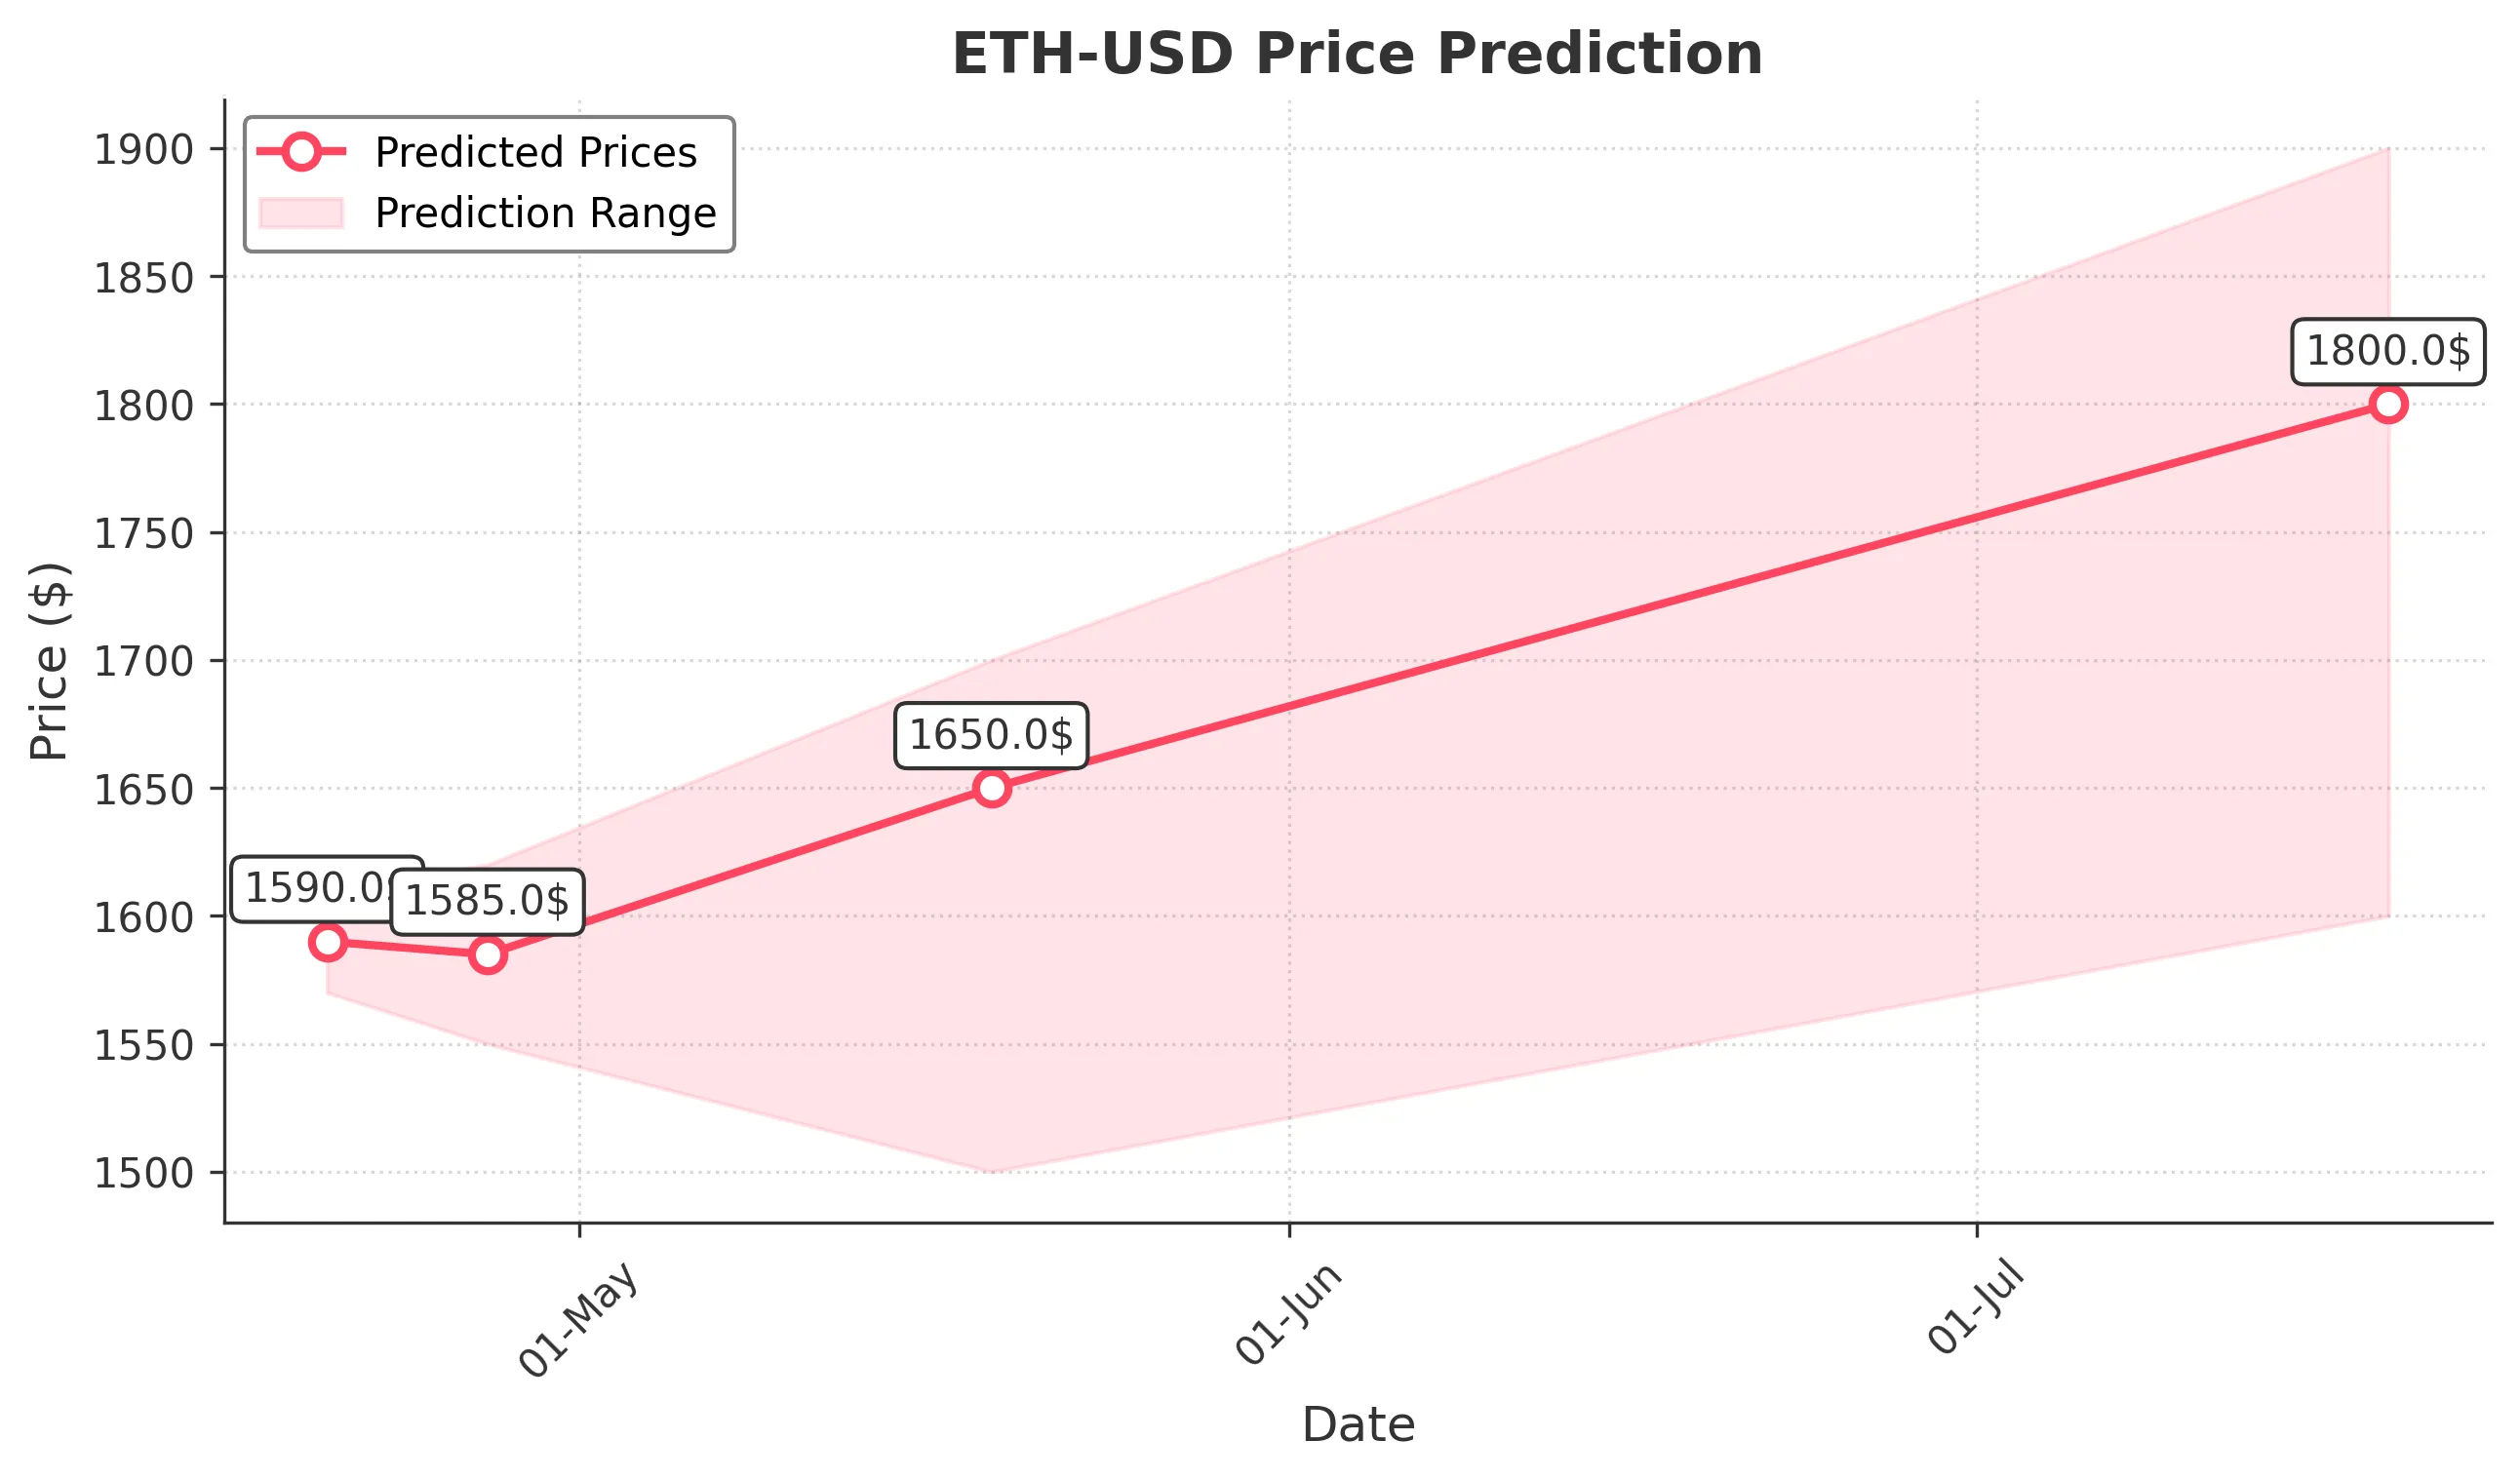
Target: April 20, 2025$1590
$1595
$1610
$1570
Description
The price is expected to stabilize around 1590.00 as recent candlestick patterns indicate indecision. The RSI is neutral, suggesting a lack of momentum, while MACD shows a bearish crossover. Volume remains low, indicating weak buying interest.
Analysis
Over the past 3 months, ETH-USD has shown a bearish trend with significant volatility. Key support is around 1570.00, while resistance is at 1610.00. The RSI indicates oversold conditions, but MACD suggests further downside potential. Volume spikes were noted during sell-offs, indicating strong selling pressure.
Confidence Level
Potential Risks
Market volatility and external news could impact price direction. A sudden bullish sentiment could push prices higher, while bearish news could lead to further declines.
1 Week Prediction
Target: April 27, 2025$1585
$1590
$1620
$1550
Description
Expect a slight recovery to 1585.00 as the market may react to potential bullish news. However, the overall bearish trend remains intact. The Bollinger Bands indicate a squeeze, suggesting a breakout could occur soon.
Analysis
The past 3 months have been characterized by a bearish trend with significant price fluctuations. Support is at 1550.00, while resistance is at 1620.00. The RSI is approaching oversold levels, indicating potential for a short-term bounce, but overall sentiment remains cautious.
Confidence Level
Potential Risks
Uncertainty in market sentiment and potential macroeconomic events could lead to unexpected price movements. A failure to break above resistance could lead to further declines.
1 Month Prediction
Target: May 19, 2025$1650
$1600
$1700
$1500
Description
A potential recovery to 1650.00 is anticipated as the market may stabilize. The Fibonacci retracement levels suggest a bounce back towards the 61.8% level. However, bearish sentiment could still prevail if resistance is not broken.
Analysis
The stock has been in a bearish phase, with significant support at 1500.00 and resistance at 1700.00. The RSI indicates potential for recovery, but MACD remains bearish. Volume analysis shows spikes during sell-offs, indicating strong selling pressure.
Confidence Level
Potential Risks
Market conditions are highly volatile, and any negative news could reverse the expected recovery. The overall trend remains bearish, and caution is advised.
3 Months Prediction
Target: July 19, 2025$1800
$1750
$1900
$1600
Description
A gradual recovery to 1800.00 is expected as market sentiment may shift positively. The long-term trend could change if key resistance levels are broken. However, macroeconomic factors could still pose risks.
Analysis
The overall performance has been bearish, with key support at 1600.00 and resistance at 1900.00. The market sentiment is cautious, and while there are signs of potential recovery, the bearish trend remains a concern. Volume patterns indicate strong selling pressure, and any bullish sentiment must be sustained to change the trend.
Confidence Level
Potential Risks
The prediction is subject to significant uncertainty due to potential market volatility and external economic factors. A bearish trend could resume if resistance levels hold.