ETH-USD Trading Predictions
1 Day Prediction
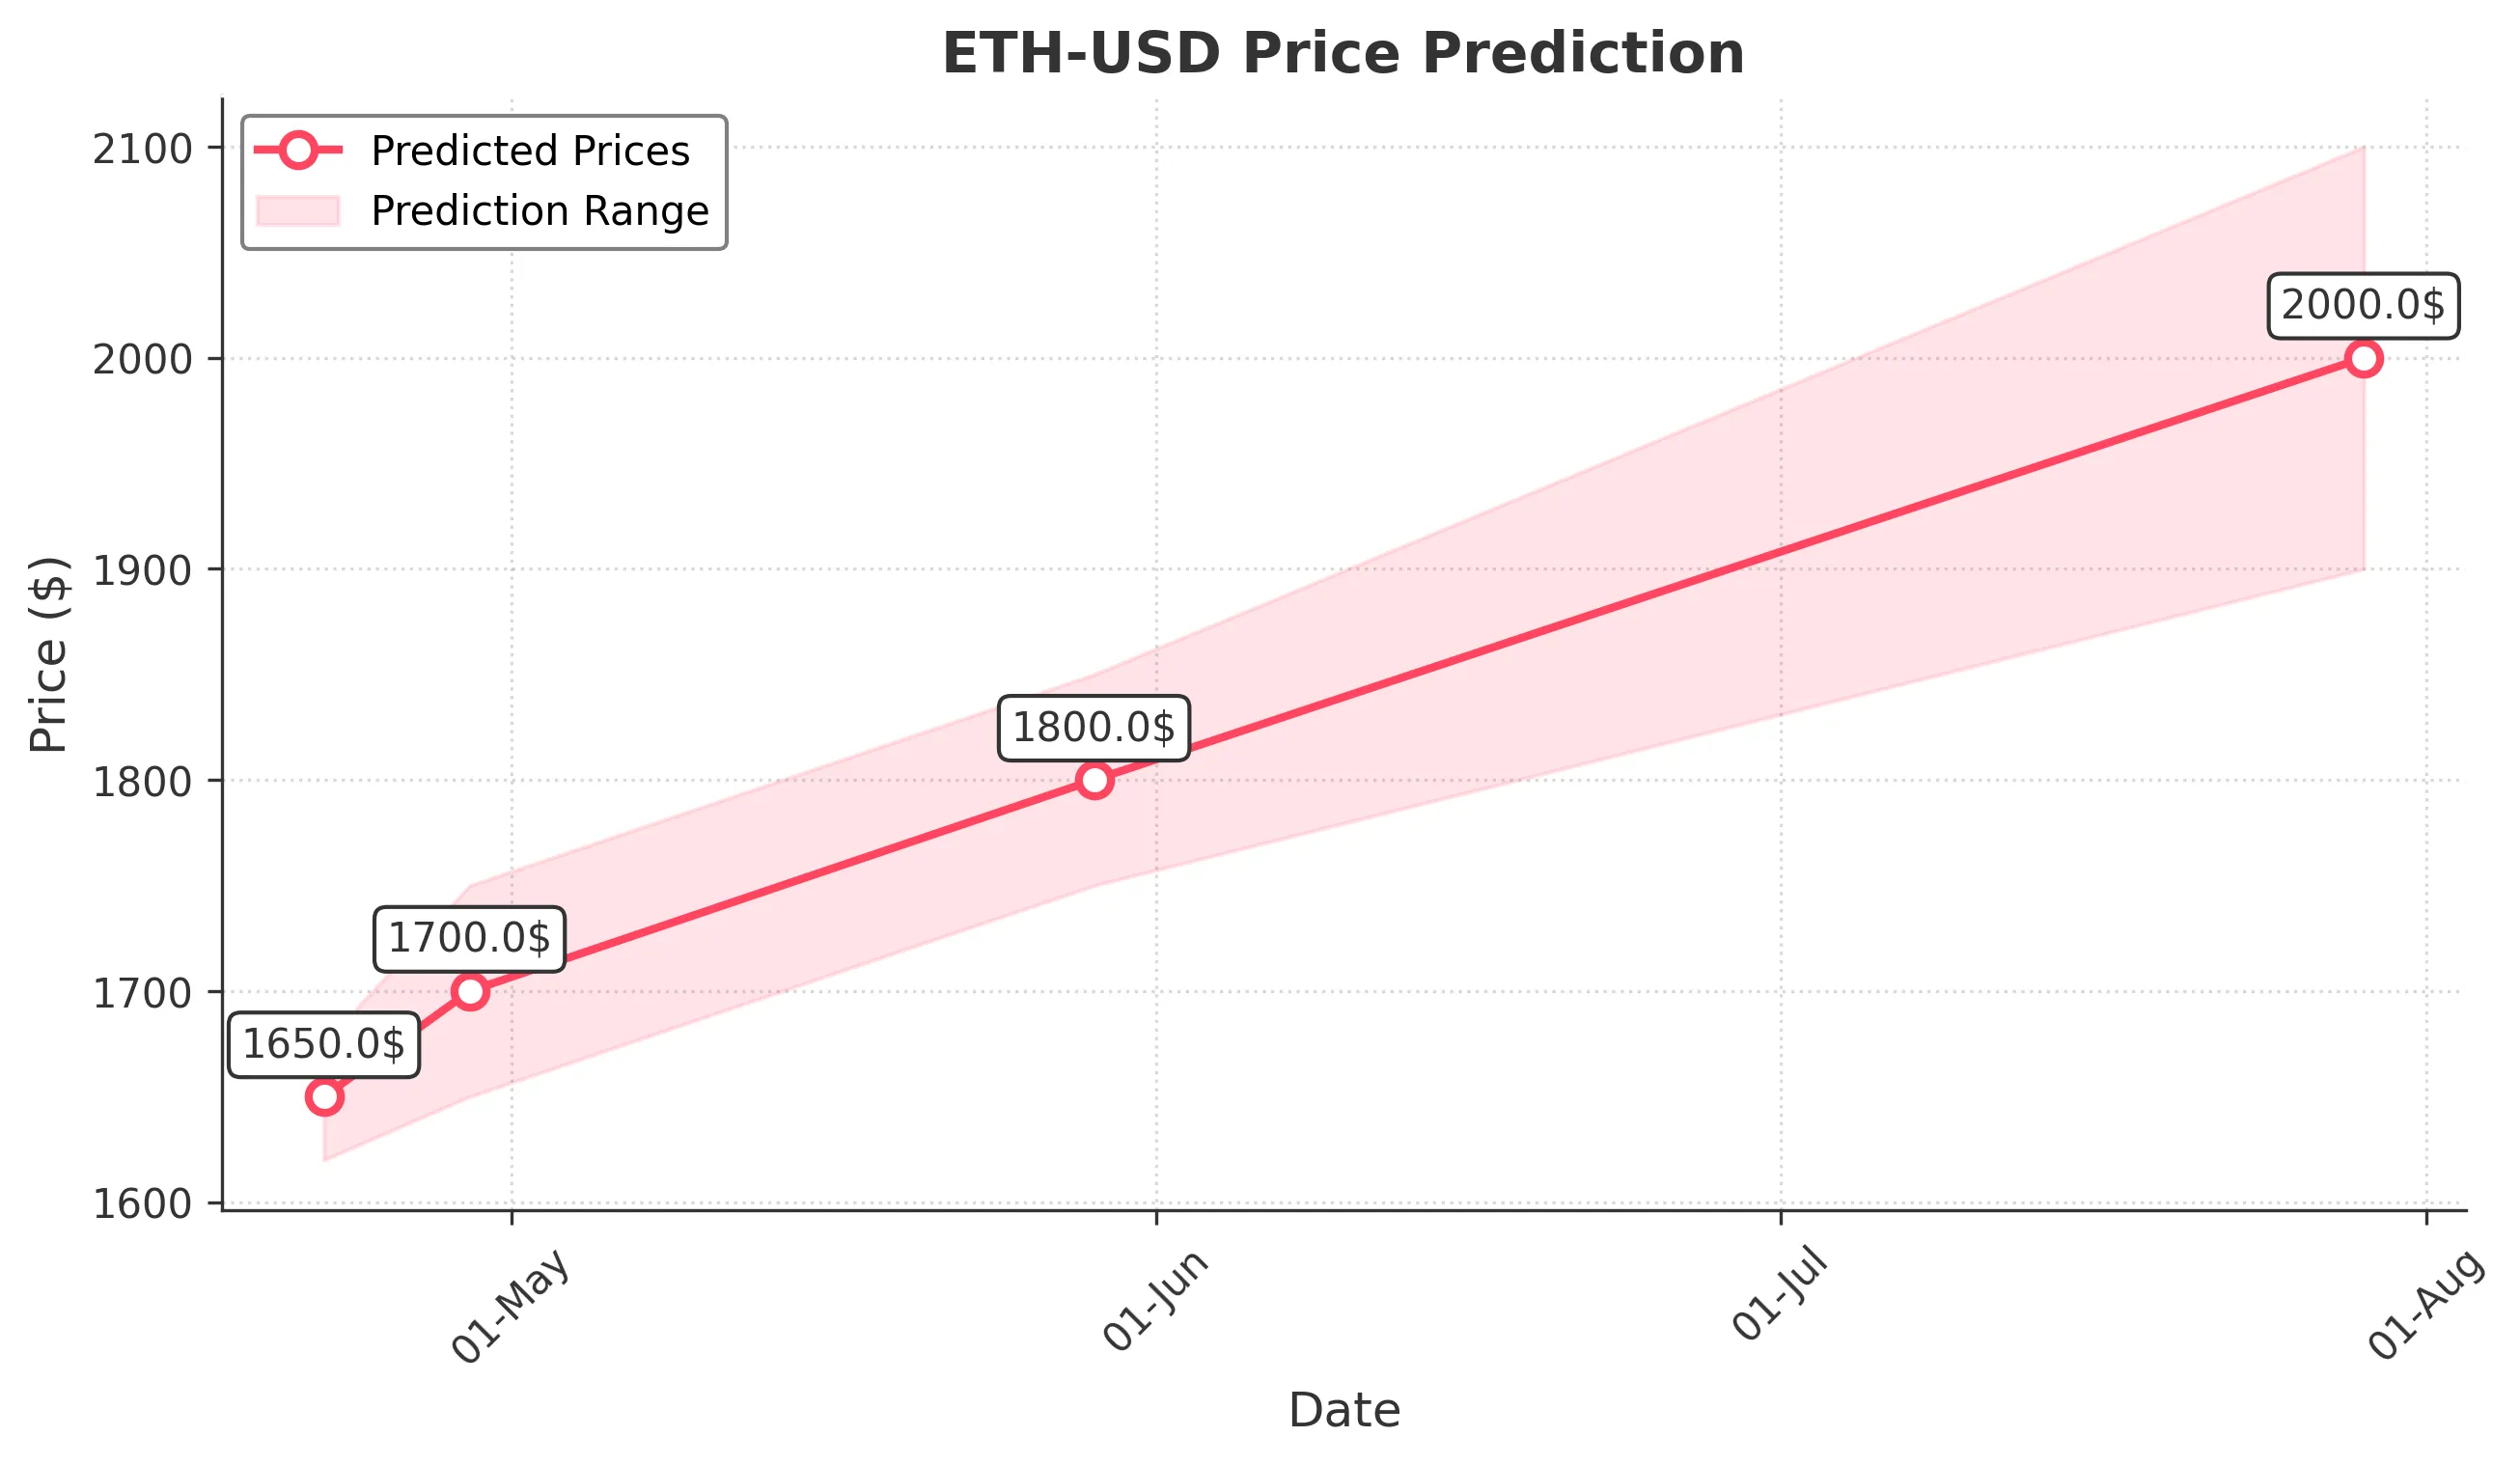
Target: April 22, 2025$1650
$1640
$1675
$1620
Description
The price is expected to stabilize around 1650.0 due to recent bullish momentum. The RSI indicates oversold conditions, suggesting a potential rebound. However, resistance at 1675.0 may limit upward movement.
Analysis
The past 3 months show a bearish trend with significant price drops. Key support is around 1550.0, while resistance is at 1700.0. Volume spikes indicate potential reversals, but overall sentiment remains cautious.
Confidence Level
Potential Risks
Market volatility and external news could impact the price significantly.
1 Week Prediction
Target: April 29, 2025$1700
$1680
$1750
$1650
Description
A gradual recovery is anticipated as bullish signals emerge. The MACD shows a potential crossover, indicating upward momentum. However, resistance at 1750.0 could pose challenges.
Analysis
The stock has shown signs of recovery after a significant drop. Key support at 1600.0 and resistance at 1750.0 are critical. The RSI is improving, suggesting a potential bullish reversal.
Confidence Level
Potential Risks
Unforeseen macroeconomic events could lead to volatility.
1 Month Prediction
Target: May 29, 2025$1800
$1780
$1850
$1750
Description
Continued bullish sentiment may push prices to 1800.0. The Fibonacci retracement levels suggest a target around this price. However, market sentiment remains fragile.
Analysis
The stock has been volatile, with a bearish trend recently. Key support at 1600.0 and resistance at 1850.0 are crucial. The ATR indicates high volatility, suggesting potential price swings.
Confidence Level
Potential Risks
Market corrections and external factors could reverse the trend.
3 Months Prediction
Target: July 29, 2025$2000
$1980
$2100
$1900
Description
If the bullish trend continues, prices could reach 2000.0. The market may stabilize as sentiment improves, but resistance at 2100.0 could limit gains.
Analysis
The stock has shown a bearish trend recently, but signs of recovery are emerging. Key support at 1800.0 and resistance at 2100.0 are critical. The overall market sentiment remains cautious.
Confidence Level
Potential Risks
Long-term predictions are uncertain due to potential market shifts.